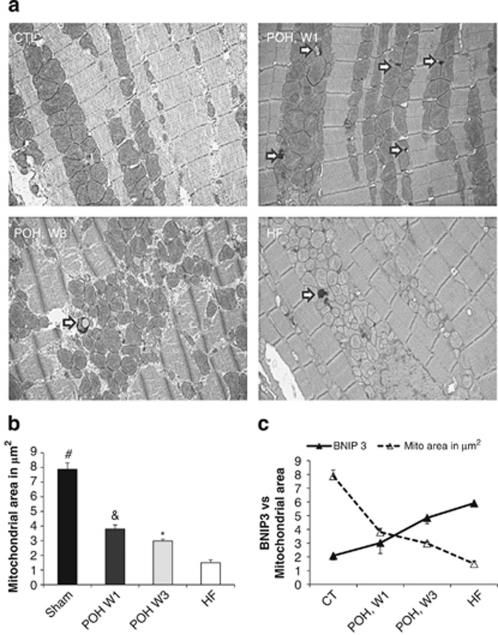
Figure 6.
The Mitochondrial area declines in POH and is the lowest in heart failure. (a) TEM images of CTL, 1–3 weeks after POH and HF. The mitochondrial area gradually declines in POH and is the lowest in HF. White arrows showing the presence of autophagolysosomes, images 5000 × magnified. (b) mitochondrial area in CTL, POH W1, POH W3 and in HF, #P<0.05 versus CTL, POH W1, POH W3 and HF, &P<0.05 versus POH W3 and HF, *P<0.05 versus HF. (c) Showing the correlation between BNIP3 expression and mitochondrial area. The mitochondrial area is inversely proportional to the increase in BNIP3 expression

