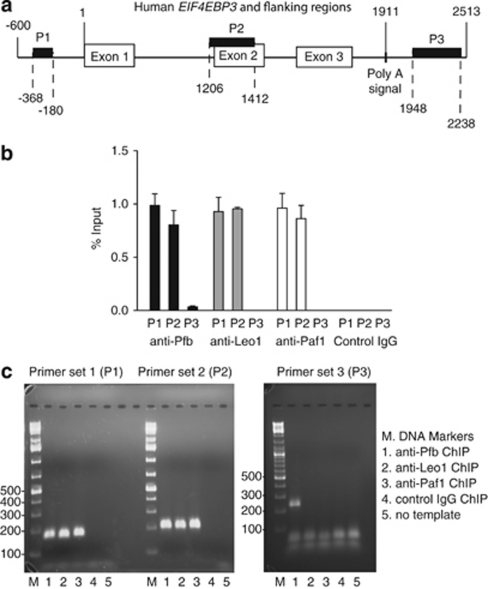
Figure 7.
ChIP demonstrates occupancy at EIF4EBP3 by the PAF1 complex. The physical association of endogenous parafibromin and other components of the PAF1 complex (including the Paf1 and Leo1 proteins) with human EIF4EBP3 was examined by ChIP in HEK293 cells. (a) Schematic diagram showing the relative location of the three PCR primer sets used in the ChIP assay (P1, P2, and P3) along the human EIF4EBP3 gene (HGNC ID: 3290) and flanking regions (not to scale). The numbering shown is relative to the first base of exon 1 as +1 as indicated. (b) ChIP analysis using primer sets targeting upstream (P1), exon 2 (P2) and downstream (P3) sequence of EIF4EBP3 using antibodies against parafibromin, Leo1 or Paf11 or control rabbit IgG as shown. Results shown are mean percentage of input signal±S.E.M. (c) Qualitative analysis of ChIP PCR-derived DNA products by agarose gel electrophoresis and ethidium bromide staining. All experiments are representative of three or more independent biological repeats

