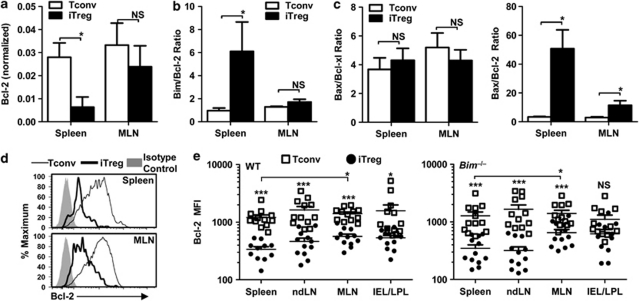
Figure 4.
Reduced Bcl-2 expression in iTregs in vivo. Foxp3GFP Tconv or CD4+CD25−CD45RBhi cells from WT or Bim−/− mice (0.5 × 10⁶) were transferred into Rag1−/− hosts. (a–c) Four weeks post transfer, iTregs (GFP+ cells) and Tconv (GFP− cells) were isolated by FACS, mRNA prepared, and expression of the genes indicated was determined by qPCR. Data shown are representative of three independent experiments with statistical analysis performed using the Mann–Whitney test (*P<0.01). (d and e) Four weeks post-transfer, iTregs and Tconv from the spleen, non-draining lymph nodes (ndLN), MLN and IEL/LPL were analyzed for intracellular Bcl-2 and Foxp3 by flow cytometry. Data are mean±S.E. of three individual experiments with 11–12 individual mice, with statistical analysis performed using standard unpaired t-test comparing Tconv/iTreg and iTreg in the spleen/MLN (*P<0.05, ***P<0.005)

