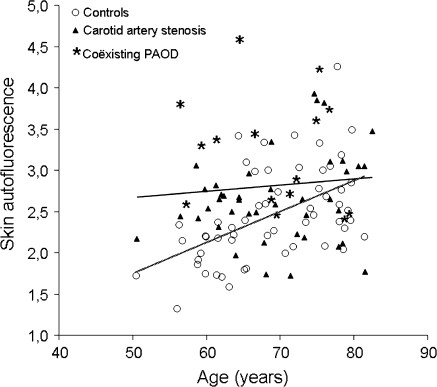
Fig. 1.
Scatter plot showing SAF in relation to age in patients with carotid artery stenosis and controls. Circles denote control subjects, triangles patients with carotid artery stenosis, stars patients with carotid artery stenosis and coexisting PAOD. Trend lines are shown for controls (dotted line) and carotid artery stenosis (continuous line). The control group exhibits the natural increase of SAF with advancing age. In the patient group with carotid artery stenosis, the relationship between SAF and age has disappeared. Patients with carotid artery stenosis and coexisting PAOD show a higher SAF than the control subjects and the patients with carotid artery disease only

