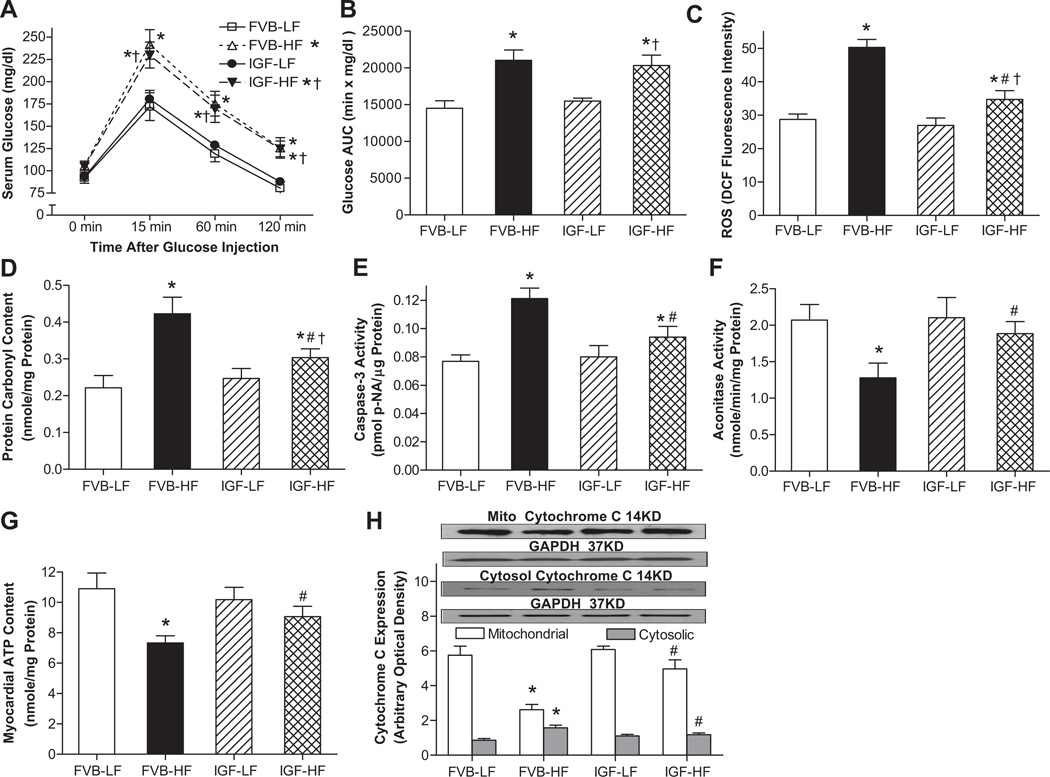
Fig. 1.
Effect of cardiac IGF-1 overexpression on glucose tolerance, ROS production, apoptosis, ATP production, protein and mitochondrial damage following low fat (LF) or high fat (HF)-diet feeding. A: IPGTT displaying serum glucose levels following glucose challenge (2 g glucose/kg body weight); B: Area under the curve (AUC) calculated from IPGTT curves; C: Cardiomyocyte ROS production; D: Myocardial protein carbonyl formation; E: Myocyte Caspase-3 activity; F: Myocardial aconitase activity; G: Myocardial ATP content; and H. Mitochondrial and cytosolic Cytochrome C expression from myocardium (normalized to the loading control GAPDH). Inset: Representative gel blots of mitochondrial and cytosolic cytochrome C as well as GAPDH using specific antibodies. Mean ± SEM, n = 7–10 mice/group, *p < 0.05 vs. FVB-LF group, #p < 0.05 vs. FVB-HF group, †p < 0.05 vs. IGF-LF group.

