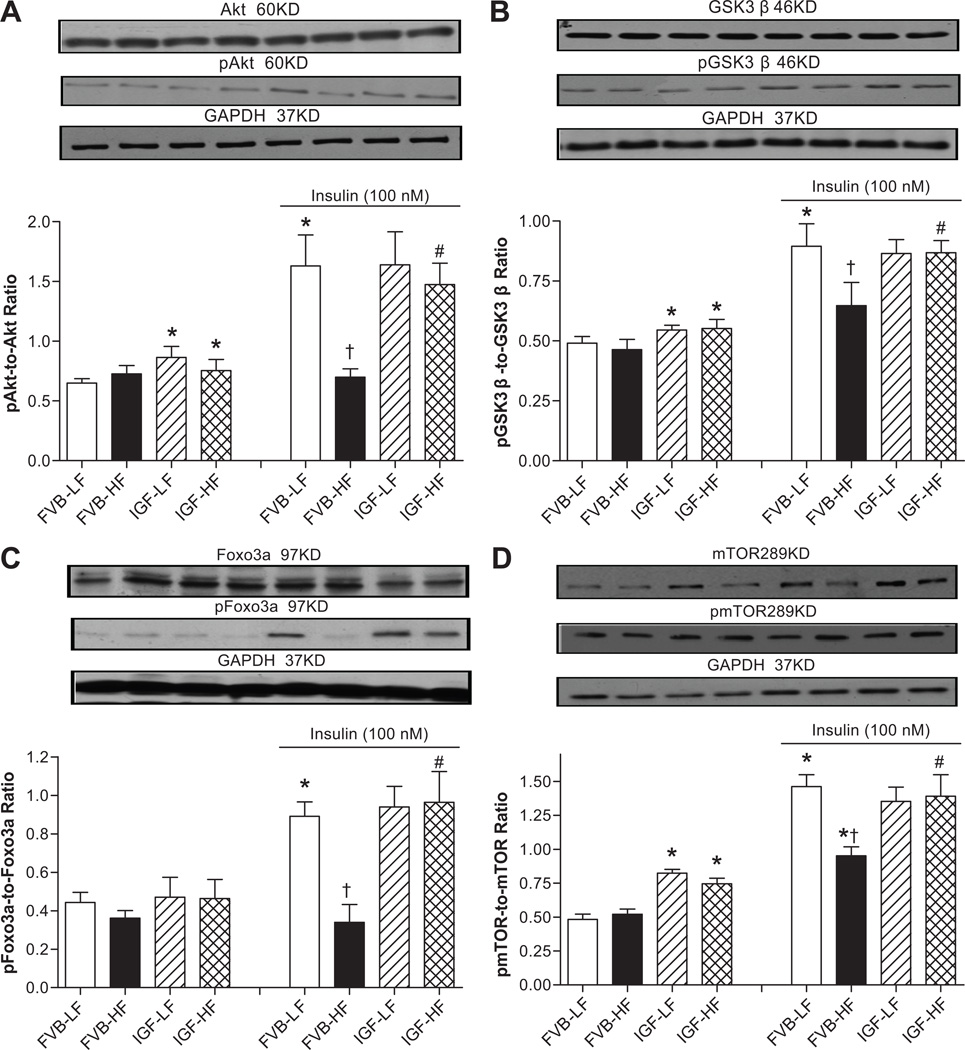
Fig. 7.
Phosphorylation of Akt, GSK3β, Foxo3a and mTOR with or without insulin stimulation (100 nM for 15 min) in cardiomyocytes from LF and HF-fed FVB and IGF-1 mice. A: pAkt-to-Akt ratio; B: pGSK3β-to-GSK3β ratio; C: pFoxo3a-to-Foxo3a ratio; and D: pmTOR-to-mTOR ratio. Insets: Representative gel blots of pan and phosphorylated Akt, GSK3β, Foxo3a and mTOR (GAPDH was used as loading control) using specific antibodies; Mean ± SEM, n = 6–9 isolations per group, *p < 0.05 vs. un-stimulated FVB-LF group, †p < 0.05 vs. insulin-stimulated FVB-LF group, #p < 0.05 vs. respective FVB-HF group.

