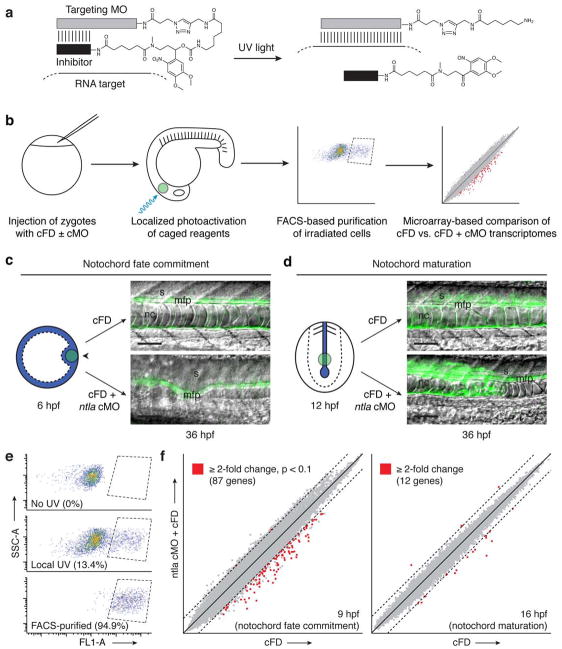
Figure 1. Notochord development is promoted by distinct Ntla transcriptomes.
a, Schematic representation of a hairpin cMO and its uncaging by UV light. b, Strategy for dynamic transcriptional profiling by integrating cMOs, photoactivatable fluorophores, FACS, and oligonucleotide microarrays. c, Depiction of a zebrafish embryo injected with either cFD or a ntla cMO/cFO mixture and then UV-irradiated within the shield domain (black arrowhead) at 6 hpf (animal pole view). Ntla-expressing cells are blue, and the irradiated region is depicted by the green circle. Trunk regions of the resulting embryos at 36 hpf are shown as overlays of differential interference contrast (DIC) and fluorescence micrographs; notochord (nc), medial floor plate (mfp) cells, and somites (s) are labeled. Micrograph orientations: lateral view and anterior left. Scale bars: 100 μm. d, Analogous depiction of an embryo similarly injected and then UV-irradiated within the posterior chordamesoderm at 12 hpf (posterior dorsal view). e, Representative log-scale FACS plots of cells obtained from 9-hpf embryos that were previously injected with cFD and either cultured in the dark or UV-irradiated as depicted in c. Fluorescence intensity (FL1-A; Ex: 488 nm, Em: 530 nm) and Side Scatter Area (SSC-A) measurements are shown; the percentage of total cells within the sorting gate (dashed lines) for each condition is indicated in parentheses. f, Microarray-based comparison of transcripts expressed within the axial mesoderm of cFD- and ntla cMO/cFD-injected embryos during gastrulation (9 hpf) or somitogenesis (16 hpf), developmental stages coincident with notochord fate commitment and maturation, respectively. Dashed lines indicate two-fold thresholds.

