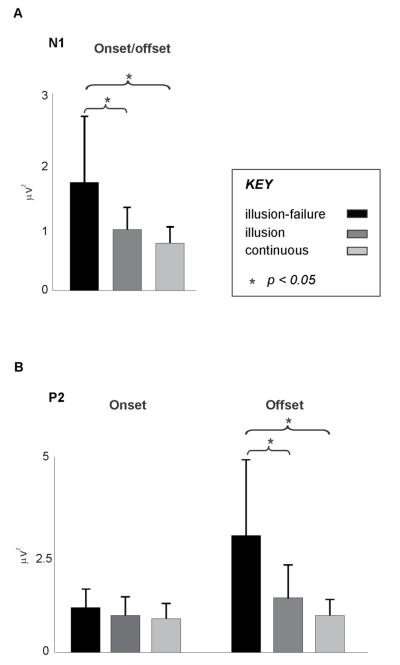
Figure 5.
A. N1 amplitude (GFP) following the onset and offset of interruptions (averaged across the two time-locking conditions) for the “illusion-failure”, “illusion”, and “continuous” percept types, averaged across all visual conditions. B. P2 amplitude (GFP) following the onset and offset of interruptions for the “illusion-failure”, “illusion”, and “continuous” percept types, averaged across all visual conditions. Error bars indicate 1 SE.

