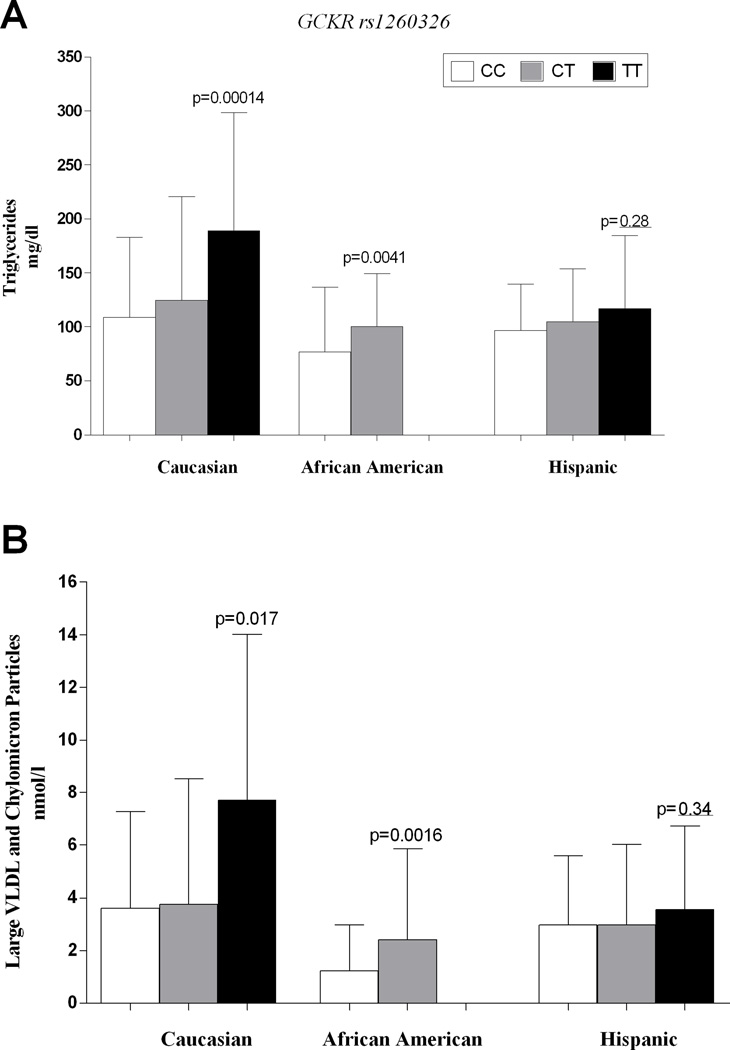
Figure 1.
The figure shows the triglyceride (panel A) and large VLDL and chylomicron particle levels (panel B) as well as the LDL size (panel C) according to GCKR rs1260326 genotype in all the ethnic groups.
Panel A. Triglyceride levels. The differences in triglyceride levels remained statistically significant after adjusting for age, gender, z-score BMI and glucose tolerance. Caucasian adjusted p-value=0.0012; African American adjusted p-value=0.0048.
Panel B. Large VLDL and chylomicron particle levels. The p-value after adjusting for age, gender, z-score BMI and glucose tolerance was =0.036 for Caucasians and p=0.0010 for African Americans.

