
Figure 4.
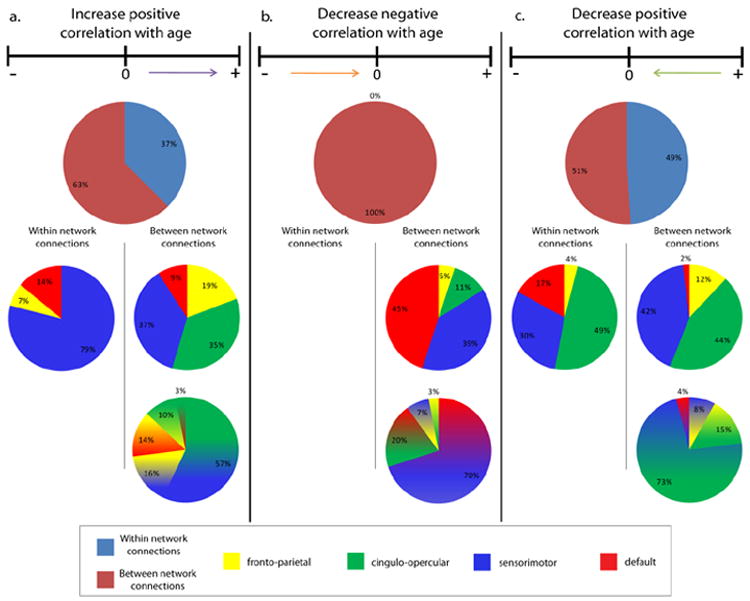
Pie charts illustrating the breakdown of the feature weight coming from (a) connections that are more positively correlated with age, (b) connections that are less negatively correlated with age, and (c) connections that are less positively correlated with age as being between network or within network, and the breakdown of these connection types based on the contributing network or networks.