FIGURE 2.
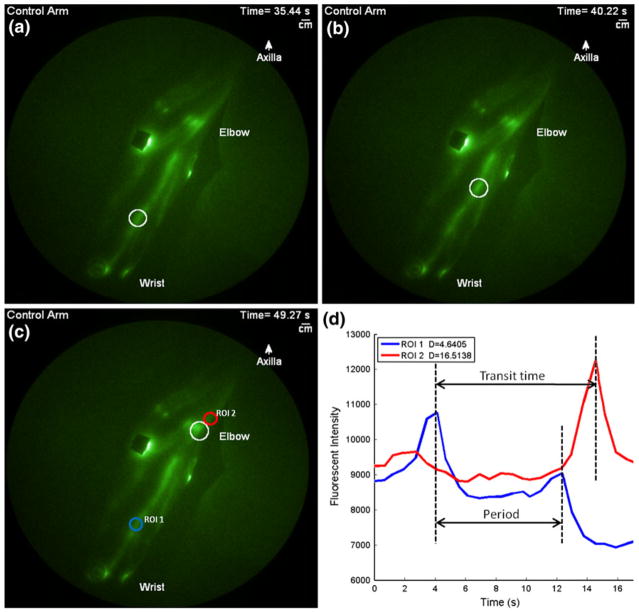
(a–c) Series of images illustrating the propagation of bolus of fluorescent lymph (white circle) from the injection sites in a control arm towards the axillary nodal basin as shown in online Video 1. (d) Plot of the fluorescent intensity profiles for the ROIs in (c). Apparent lymph velocity is calculated as the ratio of the distance (D in the legend of (d)) between ROIs and the transit time. The period is the time lapse between consecutive propulsion events in the same ROI. Images are displayed in pseudo color.

