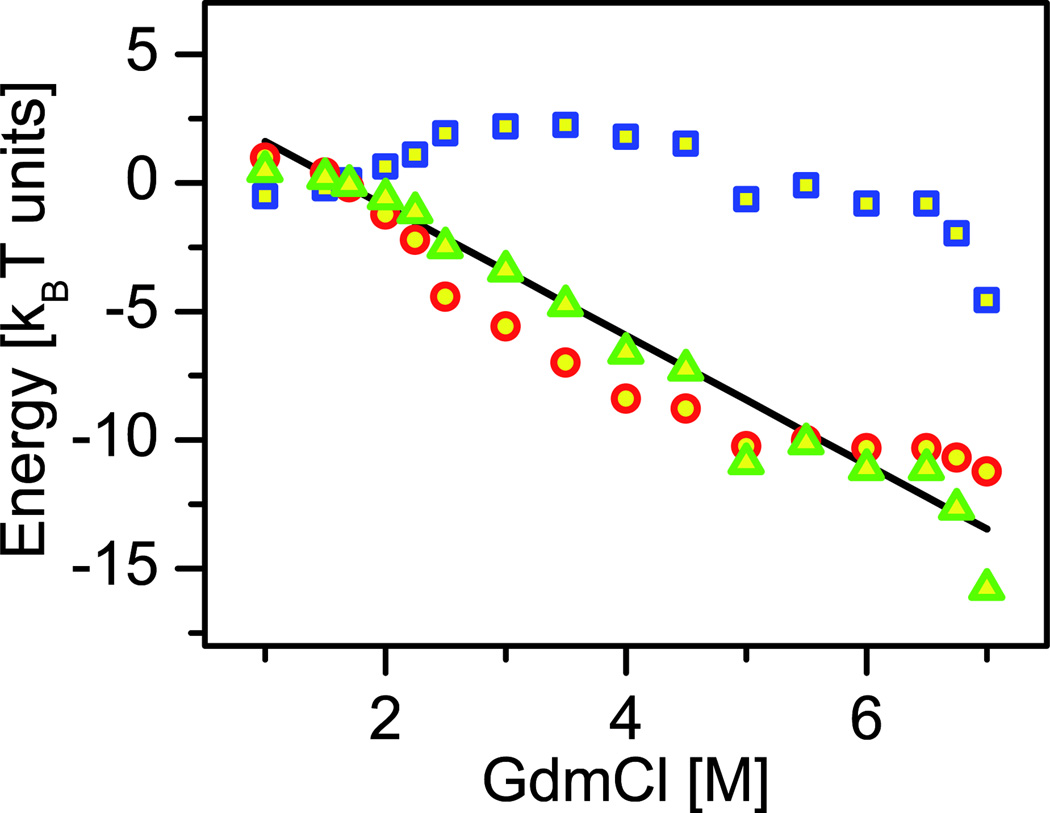
Figure 3. Sample calculation of the collapse free energy from single-molecule FRET measurements.
The collapse free energy, ΔGU→C is shown in green triangles, and is found to be linear with denaturant concentration, with a slope that matches very well the folding transition m-value (black line). ΔGU→C is also decomposed in the figure into an enthalpic part (blue squares), and an entropic part (red circles). Note the substantial contribution of the configurational entropy (based on data and analysis in ref. [60]).

