Figure 4.
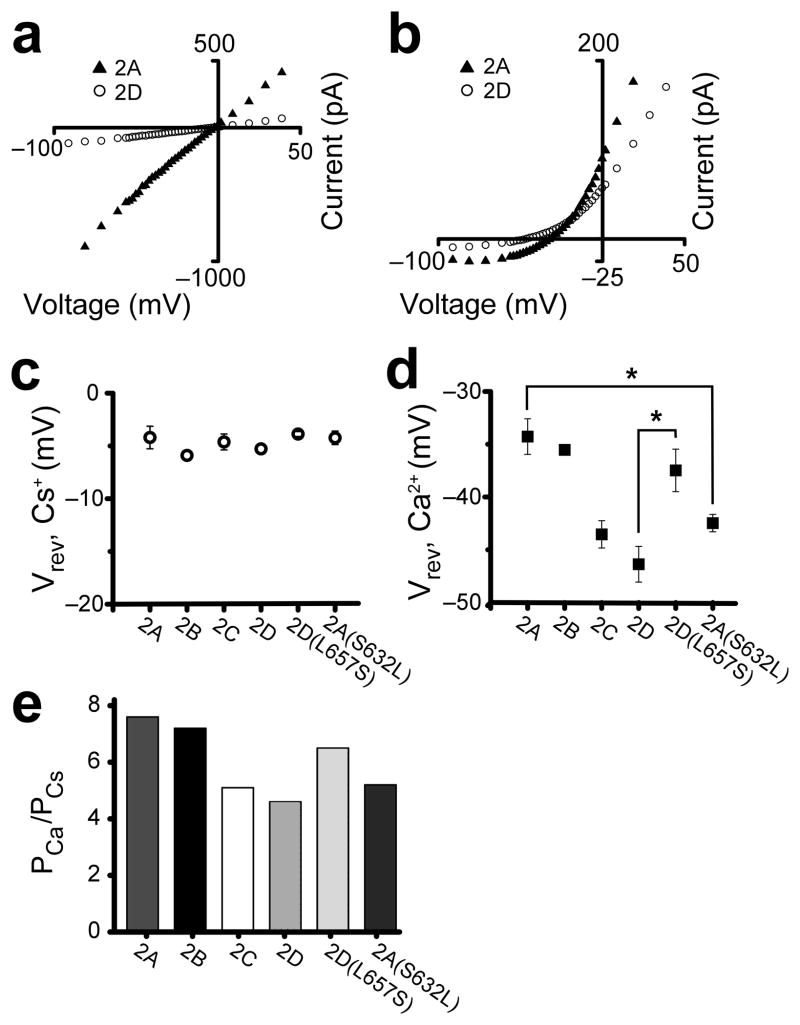
The GluN2 S/L site contributes to NMDAR subtype specificity of relative Ca2+ permeability. (a,b) Representative I–V curves in 143 mM extracellular Cs+ (a) and 1.8 mM extracellular Ca2+ (b). (c,d) Average Vrevs, ± s.e.m., of wild-type and mutant NMDARs in 143 mM extracellular Cs+ (c) and 1.8 mM extracellular Ca2+ (d). (c) No significant differences were detected among wild-type and mutant receptor Vrevs in 143 mM extracellular Cs+ (one-way ANOVA, p = 0.63). (d) Significantly different Vrevs (one-way ANOVA, p < 0.05) between wild-type and mutant receptors are marked with an asterisk. (e) PCa/PCs values of wild-type and mutant NMDARs.

