
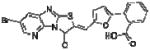
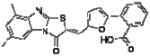
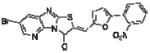
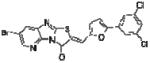
Table 1.
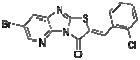
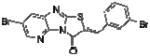
SAR and selectivity analysis for compound 1 and analogs (IC50 values in μM).
| Cmpd # | PubChem CID | Structure | HePTP | MKP-3 | VHR | STEP | PTP-SL | PTP1B | LYP | TCPTP | SHP1 | SHP2 | CD45 | LAR |
|---|---|---|---|---|---|---|---|---|---|---|---|---|---|---|
| 1* | 1357397* |
|
0.21 | 5.2 | 1.9 | 6.3 | 1.1 | 1.7 | 1.9 | 1 | 2.5 | 1.1 | 3.1 | 73 |
| 2 | 5341943 |
|
1.8 | 17 | 5.8 | ~100 | 20 | 28 | 30 | n/d | n/d | n/d | n/d | n/d |
| 3 | 5341934 |
|
4.9 | 57 | 12 | >100 | 41 | ~100 | ~100 | n/d | n/d | n/d | n/d | n/d |
| 4 | 2300608 |
|
5.7 | >100 | 8.8 | >100 | ~100 | >100 | >100 | n/d | n/d | n/d | n/d | n/d |
| 5 | 2258411 |
|
35 | >100 | >100 | >100 | >100 | >100 | >100 | n/d | n/d | n/d | n/d | n/d |
| 6 | n/a |
|
>100 | >100 | >100 | >100 | >100 | >100 | >100 | n/d | n/d | n/d | n/d | n/d |
*
Compound 1 was submitted as a probe to the Molecular Libraries Probe Production Centers (MLPCN) and has the Probe ML# ML119.