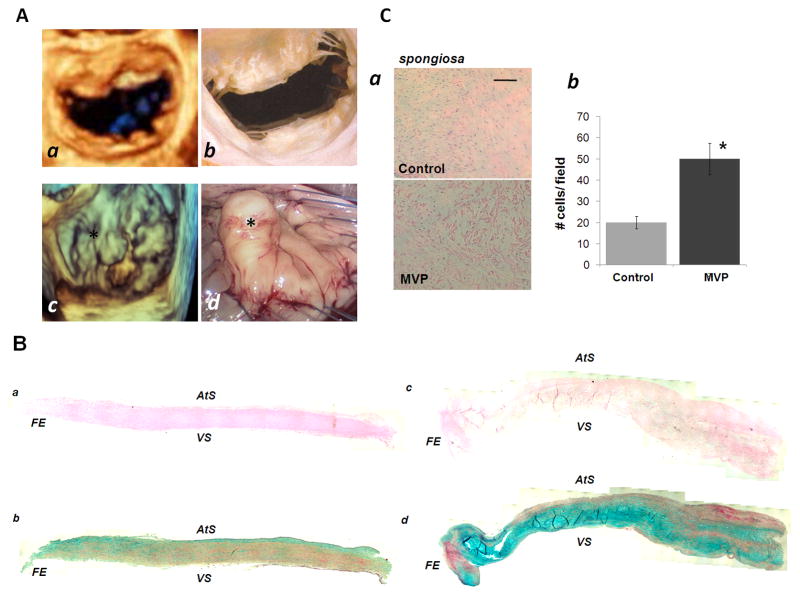
Figure 1. Macroscopic and Histological Analysis of myxomatous mitral valve and control.
[A] Comparison between normal mitral valve and patient with P2 prolapse and mitral regurgitation: (a) 3D Echocardiographic appearance of normal mitral valve with no evidence of prolapse, (b) Normal mitral valve in cadaver, (c) 3D echocardiographic appearance of P2 prolapse (marked by asterisk *) in patient with mitral regurgitation (d) intra-operative videoscopic view of prolapsed P2 scallop prior to resection. [B] Composite photomicrographs of sections of human mitral valve leaflets (transverse sections). Controls (a and b), and diseased valves (c and d) high-definition images have been assembled to rebuild the leaflet structures. H&E (a, c) and Movat Pentachrome staining (b, d) are reported. FE: free edge; VS: ventricularis, AtS: Atrialis [C] (a) Representative image of H&E section of the mitral valve spongiosa layers of control and MVP patient and relative number of VICs per field, (b) quantification of total cell number within selected fields of the spongiosa layers. Bar graph: 50 μm.

