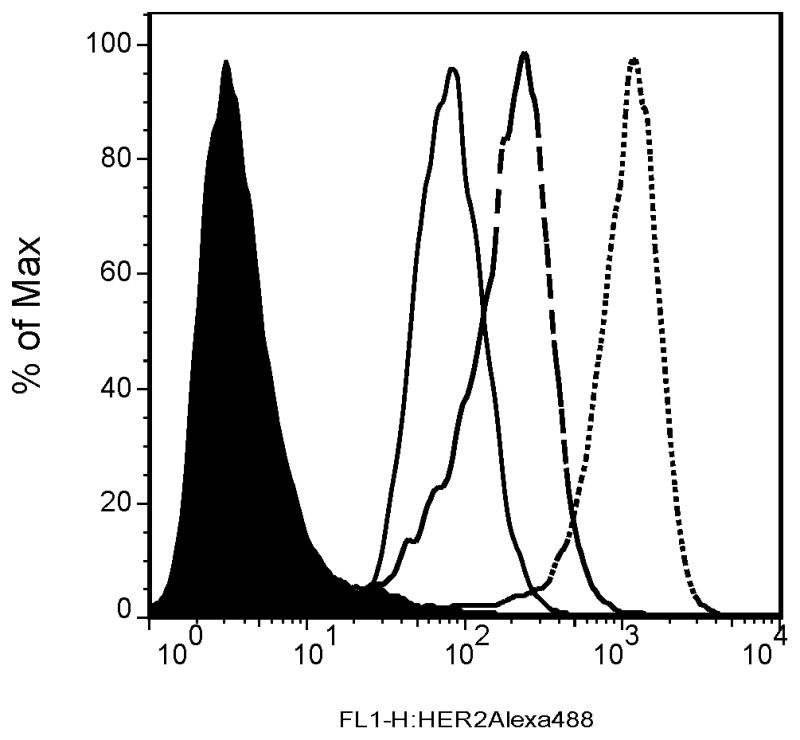
Figure 1.

Flow cytometry results showed low (MCF7 parental; ———), intermediate (Clone A; ---), and high (Clone B; ·····) expression levels of Her2, respectively, in comparison with the control MCF7 parental cells (filled black) that were only stained with the secondary (nonspecific) antibody. The single peaks for each sample indicate pure cell populations.
