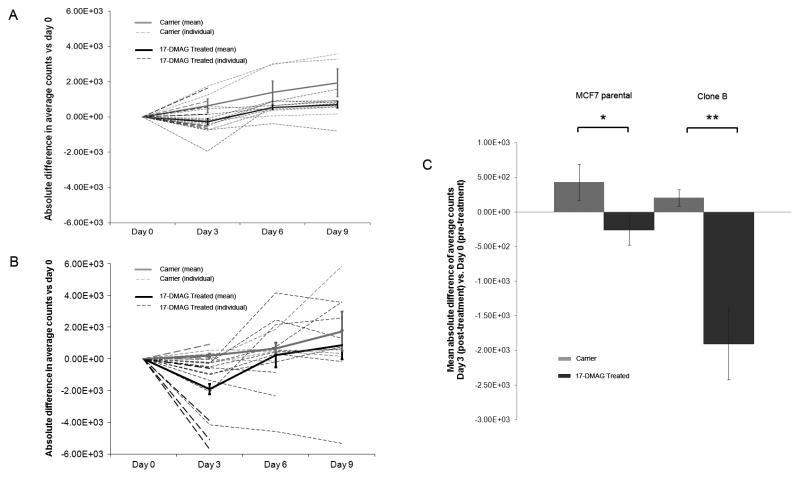
Figure 3.
Absolute difference in average counts for MCF parental (A) and Clone B tumors (B): Treatment vs. Carrier compared to Day 0 (pre-treatment). At Day 0, mean average counts/mm2 were 2759 for MCF7 parental (A) and 6402 for Clone B tumors (B). Dashed lines represent the individual mice, solid lines the mean and error bars the standard error of the mean. Both MCF7 parental tumors (A) and Clone B tumors (B) showed a significant decrease in average counts at Day 3 for the 17-DMAG treated compared to the carrier group (p = 0.05 and p = 0.004, respectively). At day 3, optical imaging signal was reduced by 9% in 17-DMAG treated MCF7 parental tumors (p = 0.23) and by 22.5% in Clone B tumors (p = 0.003); signal recovered at day 6–9. Mean absolute difference in average counts of Day 3 (post-treatment) vs. Day 0 (pre-treatment) is also shown separately (C). Optical imaging signal decreased significantly for the 17-DMAG treated mice compared to the carrier mice for both MCF7 parental (* p = 0.05) and Clone B (** p = 0.004) tumors. Error bars represent the standard error of the mean.

