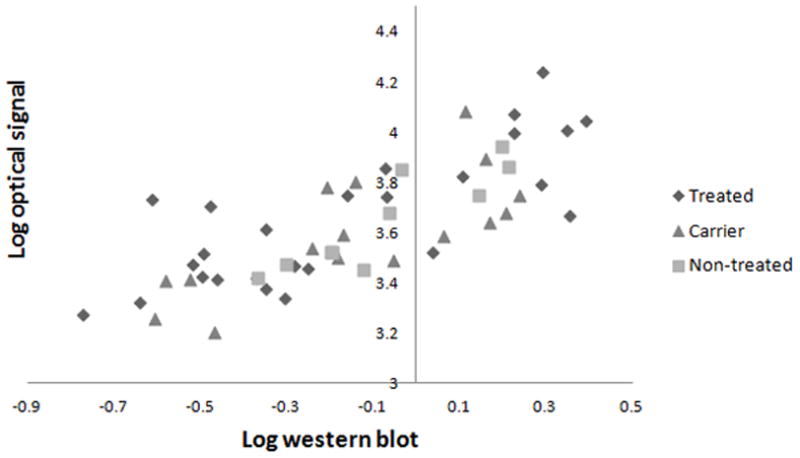
Figure 5.

Correlation between ex vivo Her2 levels by Western and in vivo optical imaging signal. Pearson’s correlation coefficient was 0.77 (y = 0.60x + 3.72) for the total group of tumors (n=52); 0.74 (y = 0.52x + 3.75) for the treated group at day 9 (n=18); 0.84 (y = 0.82x + 3.80) for the carrier group at day 9 (n=8); 0.73 (y = 1.01x +3.69) for the treated group at day 3 (n=8); 0.85 (y = 0.45x + 3.62) for the carrier group at day 3 (n=8); and 0.89 (y = 0.74x + 3.70) for the non-treated group (n=10).
