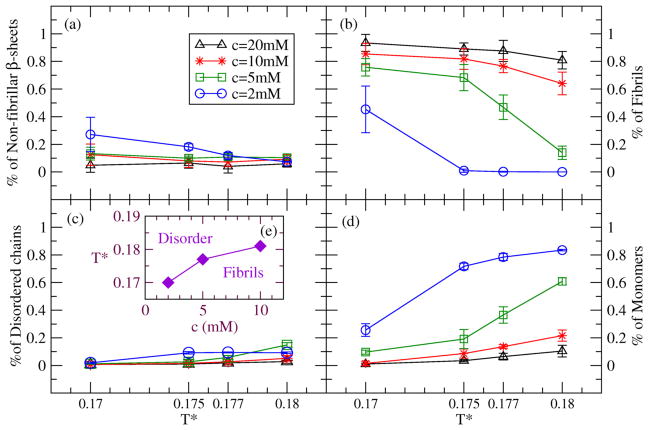
Figure 3.
Concentration titration of four observables at four temperatures (T*=0.17, 0.175, 0.177 and 0.18) for STVIIE. Concentrations are 20mM (black triangle), 10mM (red star), 5mM (green square), and 2mM (blue circle). Percentage of peptides in (a) non-fibrillar β-sheets, (b) fibrils, (c) disordered aggregates and (d) monomers. (e) Phase diagram for three concentrations based on our simulations.

