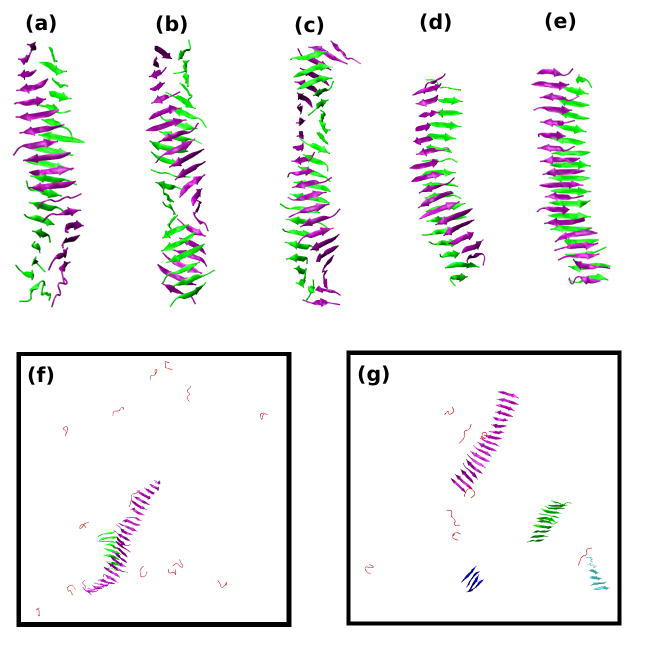
Figure 4.
Final structures near Tf and at c=10mM for seven sequences. (a) STVIIE at T*=0.18. (b) STVIFE at T*=0.18. (c) STVIVE at T*=0.175. (d) STAIIE at T*=0.17. (e) STVIAE at T*=0.17. (f) STVIGE at T*=0.165. (g) STVIEE at T*=0.165. The only structures shown for the first five sequences are the dominant fibril structures; monomers and small oligomers are not shown. All structures are shown for the last two sequences. The β-sheets are depicted with different colors for easy viewing.

