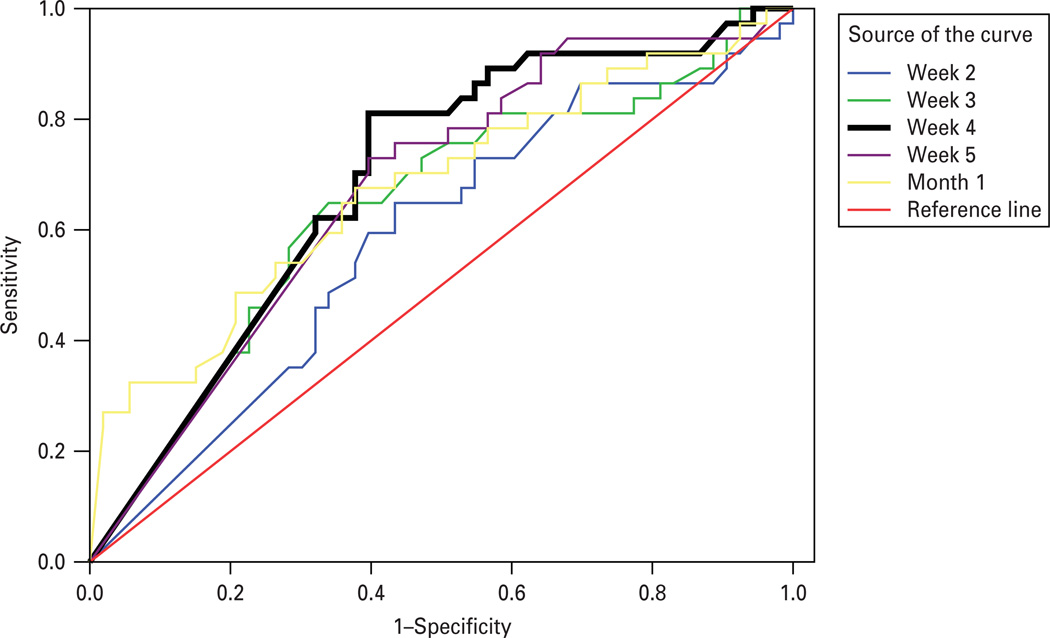
Fig. 1.
Receiver operating characteristics (ROC) curves predicting binge remission post-treatment based on percentage reduction in binge eating (determined by prospective daily self-monitoring) observed at weeks 1–5 and for total of month 1. ROC curve for the fourth week is most predictive and is shown in bold. The fourth week ROC had AUC of 0.688 (s.e. = 0.057), with 95% CI 0.578–0.799, p = 0.002). A 70% reduction in binge-eating frequency by the fourth week maximized sensitivity (0.79) and specificity (0.39) for predicting binge-eating remission (determined by the Eating Disorder Examination at post-treatment). Diagonal segments are produced by ties.

