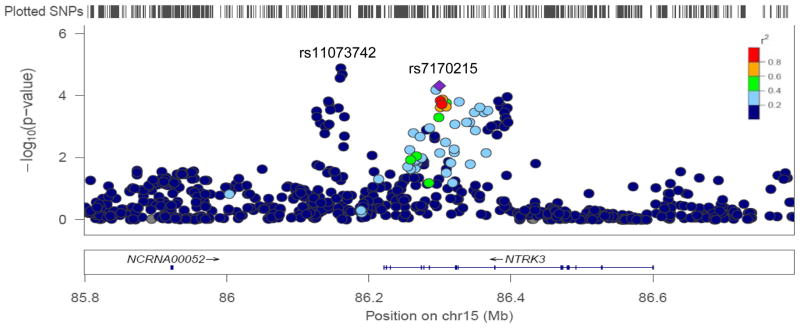
Figure 2.
Regional plot of the NTRK3 loci
Shown is the SNP association with serum BDNF concentration for the NTRK3 loci (with −log10 P values on the y axis and the SNP genomic position on the x axis). The index SNP rs7170215 is denoted with a purple diamond. SNPs are colored to reflect LD with the index SNP (pairwise r2 values from HapMap CEU). Gene and microRNA annotations are from the UCSC genome browser. LocusZoom (http://csg.sph.umich.edu/locuszoom/) was used for this plot.

