Figure 1.
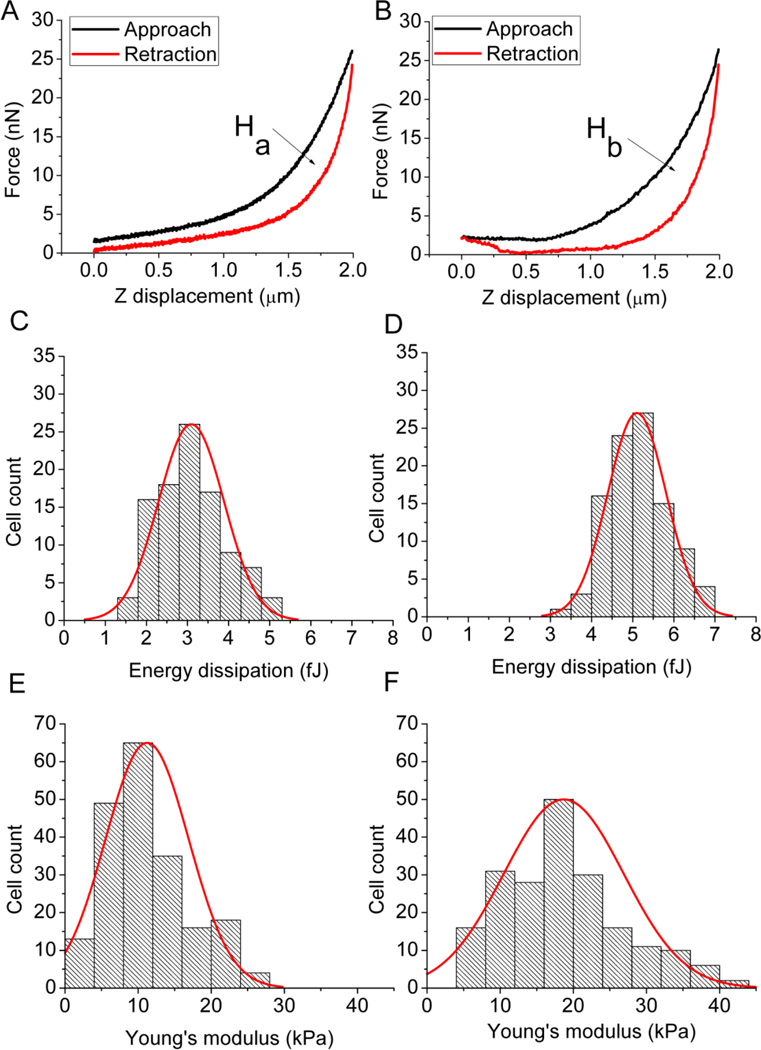
Typical force displacement curves from AFM force curve measurement of the A431 cell in the absence of EGF (A), and in the presence of 40 nM of EGF (B). The area of the hysteresis loop (Ha and Hb), enclosed between the approach and retraction curves, corresponds to the energy dissipation, which increased from 2.9 fJ of Ha (A) to 5.2 fJ of Hb (B). Histograms of the distributions of the energy dissipation of one hundred randomly selected cells with (C) and without the EGF stimulation (D). The energy dissipation increased from 3.09 ± 0.79 fJ in the absence of EGF (C) to 5.10 ± 0.71 fJ (mean ± SD, p < 0.05) in the presence of 40 nM of EGF (D). Histograms of the distributions of the Young’s modulus of two hundred randomly selected cells with (E) and without the EGF stimulation (F). The Young’s modulus increased from 11.2 ± 2.8 kPa in the absence of EGF (E) to 18.7 ± 2.0 kPa (mean ± SD, p < 0.05) in the presence of 40 nM of EGF (D).

