
Figure 3.
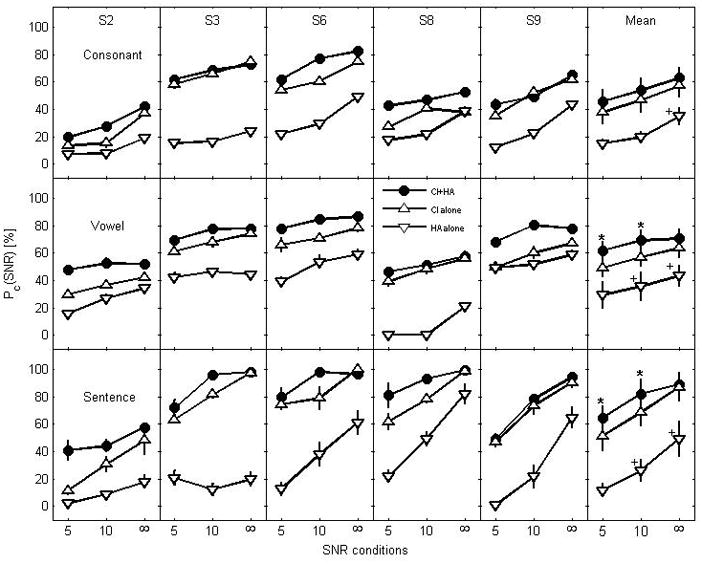
Individual and group mean recognition performance with standard error for the good group as a function of SNR with CI+HA, CI alone and HA alone. Each row represents speech materials. Each column represents subject. Group mean scores are presented in the most right column.