
Figure 5.
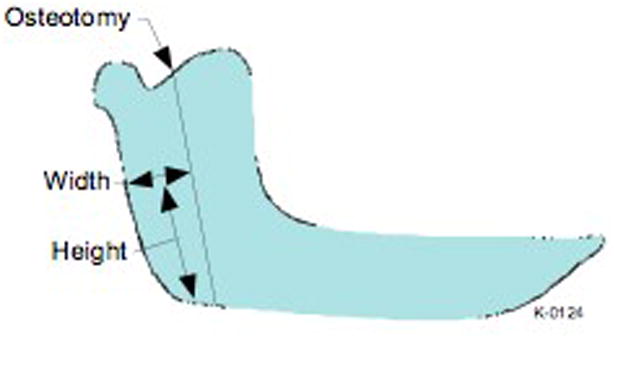
Schematic representation of a pig’s mandible with the osteotomy cut illustrated. The distance from the posterior border of the mandible to the osteotomy was measured at specific heights.
Official websites use .gov
A
.gov website belongs to an official
government organization in the United States.
Secure .gov websites use HTTPS
A lock (
) or https:// means you've safely
connected to the .gov website. Share sensitive
information only on official, secure websites.
Schematic representation of a pig’s mandible with the osteotomy cut illustrated. The distance from the posterior border of the mandible to the osteotomy was measured at specific heights.