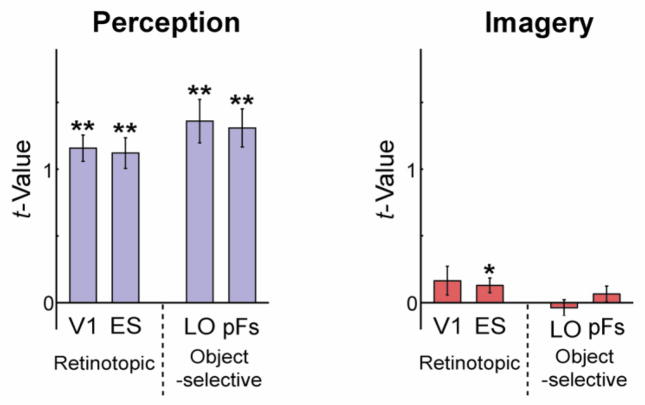
Figure 3.
The average magnitude of response in retinotopic (V1, ES) and object-selective (LO and pFs) regions during perception and imagery. Response was roughly 10 times larger during perception than imagery. Error bars represent ± 1 SEM, calculated across participants (for one-sample planned t-tests, *: p < 0.05; **: p < 0.01).

