
Figure 5.
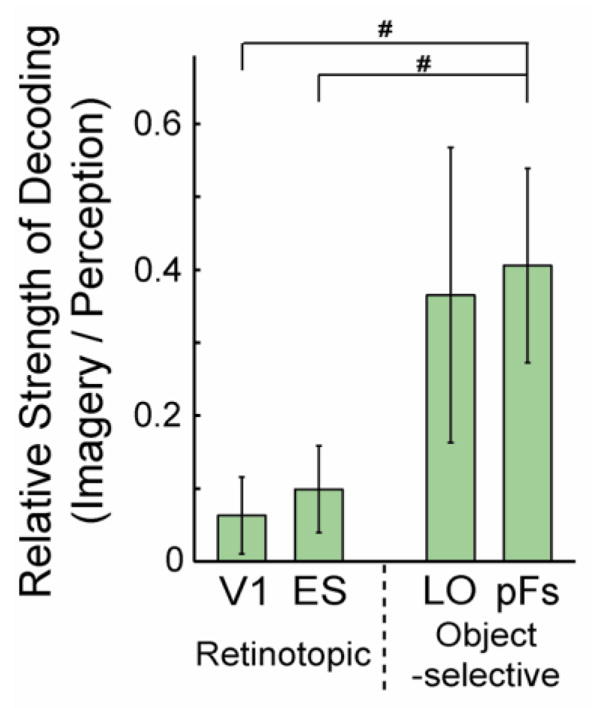
Relative strength of decoding: imagery to perception. The ratio of the discrimination indices during imagery to the indices during perception was significantly greater in object-selective regions than retinotopic regions. All error bars represent ± 1 SEM, calculated across participants (for paired t-tests, #: p < 0.05).