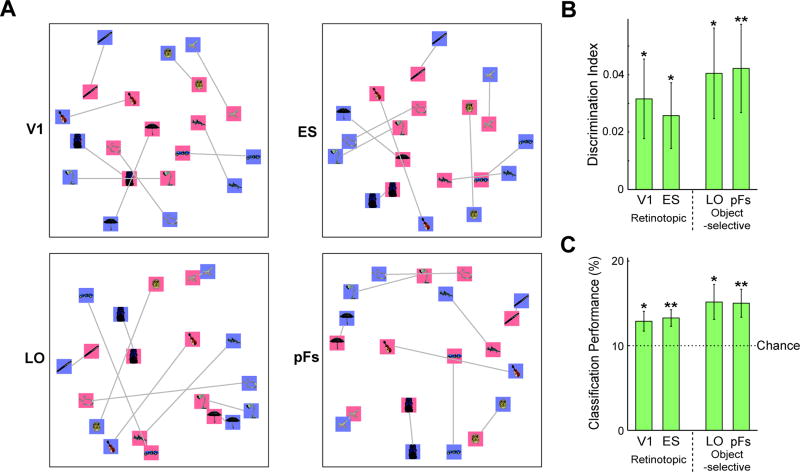
Figure 6.
Similarity between visual imagery and perception. A, Relations between object conditions based on Multi Dimensional Scaling (MDS). Blue and red backgrounds indicate perception and imagery conditions, respectively, and gray lines indicate the matching object conditions. Imagery and perception conditions aligned, particularly in pFs. The MDS also highlights the greater similarity between imagery conditions compared with perception conditions in V1, much less than in pFs. B, Discrimination indices between seen and the corresponding imagined objects in V1, ES, LO and pFs. Discrimination of objects between imagery and perception was significant in all ROIs.. C, Classification performance with SVMs showed a similar pattern to the discrimination indices between imagery and perception conditions. The chance level was 10 %. All error bars represent ± 1 SEM, calculated across participants (for one-sample planned t-tests, *: p < 0.05; **: p < 0.01).

