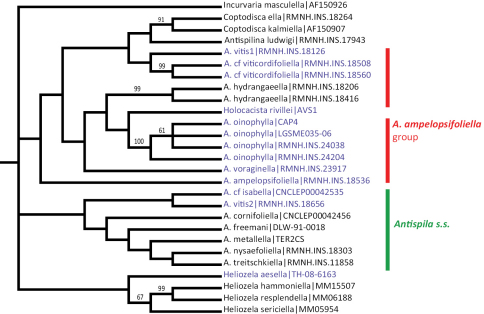
Figure 31.
Cladogram, 50% majority rule consensus of three shortest trees from maximum parsimony analysis of COI sequences. CI = 0.361, RI = 0.456, RC = 0.168. Figures are bootstrap values from a TNT analysis (10,000 bootstrap replicates). Purple-coloured taxa are feeding on Vitaceae. The semi-strict tree differs only in the position of Heliozela aesella (see text).

