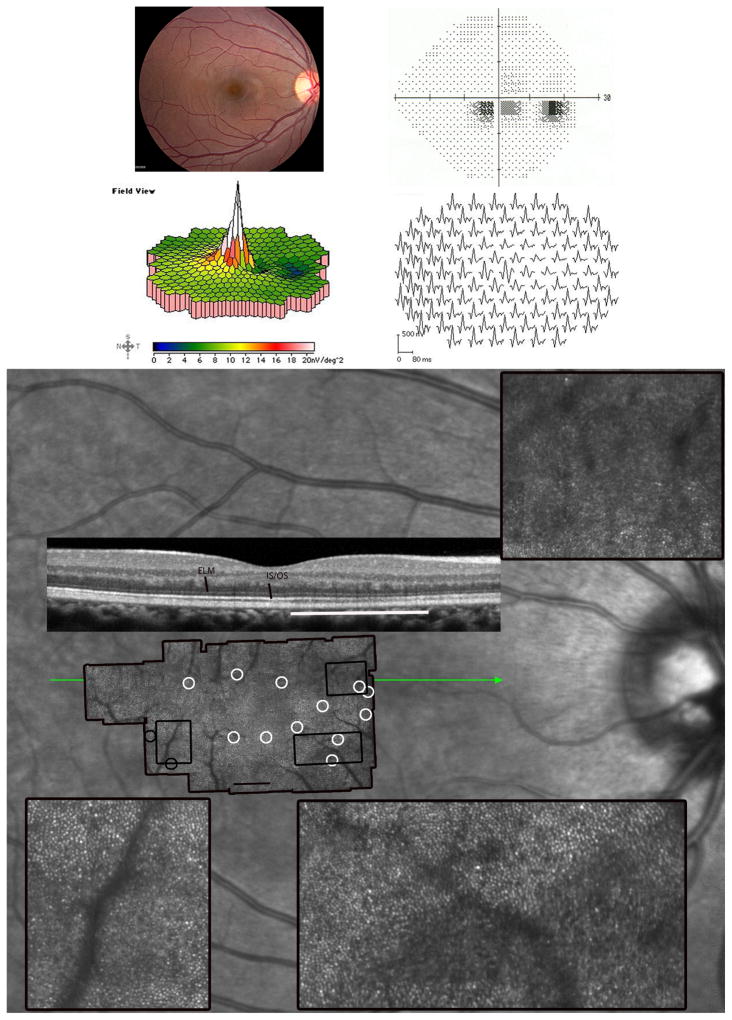
Figure 1. Acute Zonal Occult Outer Retinopathy.
Patient 1, right eye; similar findings were present in the left eye (not shown). (Top left) The fundus examination was normal. (Top right) Parafoveal visual field (VF) defects with normal foveal sensitivities. (Middle) The multifocal electroretinographic first-order response traces, displayed in field view, reveal a discrete region, 50 temporal to fixation, of abnormally reduced response densities with delayed timing. (Bottom) Adaptive optics scanning laser ophthalmoscopy (AOSLO) images superimposed on an infrared fundus image reveal abnormal cone reflectivity in regions corresponding to the visual field defects and reduced multifocal electroretinography (mfERG) responses. The composite AOSLO image, which spans approximately 7.7×4.6 0, shows areas of reduced cone reflectivity around the foveal center, but otherwise contiguous cones with normal spacing (white circles). The insets, indicated by the black rectangles on the AOSLO montage, highlight retinal regions with contiguous cone coverage interspersed with areas of reduced retinal reflectivity. The lower insets show distinct transitions between normally-reflecting cones and reduced reflectance regions with less obvious cone mosaics. The left inset with black circles surrounding it demonstrates a retinal region with abnormal cone spacing. The spectral domain optical coherence tomography (SDOCT) scan (green line indicates scan location) shows irregularities in the inner segment/outer segment (IS/OS) junction corresponding with reduced reflectivity of cones. External limiting membrane (ELM) and IS/OS junction layers are labeled. The most affected region of the b-scan is indicated by the white line. Areas of reduced cone reflectivity correspond to regions of reduced sensitivity on the visual field test. Scale bar is 10.

