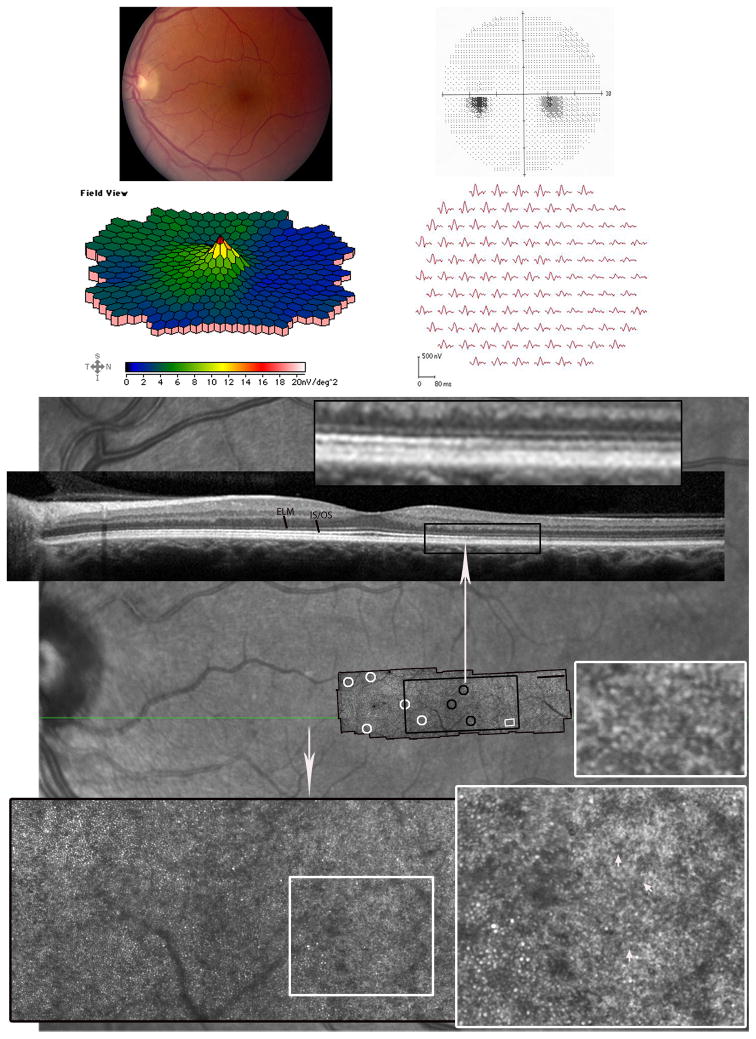
Figure 2. Acute Zonal Occult Outer Retinopathy.
Patient 2, left eye. (Top left) Mild retinal pigment epithelium (RPE) hypopigmentation was present temporal to the fovea. (Top right) Paracentral 100 scotoma nasal to fixation with normal foveal sensitivity. (Middle) The multifocal electroretinographic first-order response traces, displayed in field view, reveal a discrete area of reduced response density with delayed timing from 5-200 nasal to fixation. The area of reduced function corresponds to the paracentral scotoma present on VF testing and the retinal region with affected cone spacing. (Bottom) The AOSLO image, which spans approximately 8.9×2.40, is superimposed on an infrared fundus image (scale bar is 10). Cone spacing and coverage are normal (white circles) in all areas except locations near the relative scotoma (demarcated by the long white arrow), within which no cones are visible. The large inset (black rectangle) highlights the retinal region of normal cone spacing transitioning into abnormal or sparse cone spacing (black circles). The smaller insets (white squares) show a transition from cones to a localized region of hexagonal cells (white arrows) in addition to a localized retinal region with tightly packed cells, suspected to be rods.. The retinal region where RPE cells were observed is different from the region noted with presumed rods. The SDOCT scan (location indicated by the green line on the background image) shows reduced reflectance of the IS/OS junction within the relative scotoma. The inset above the SDOCT b-scan highlights the reflectance change.

