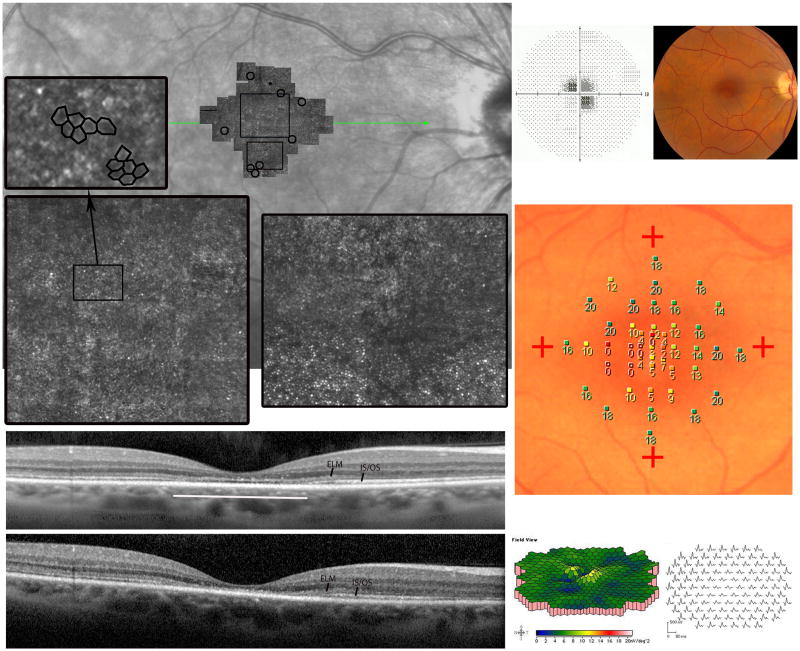
Figure 5. Acute Zonal Occult Outer Retinopathy.
Patient 4, right eye. (Top left) The composite AOSLO image, which spans approximately 7.7×70 (scale bar is 10) is superimposed on an infrared (IR) SLO fundus image. The AOSLO image shows a region of abnormal cone structure within the macula. The preferred retinal locus for fixation is superior to the anatomical fovea, labeled with a small black circle. Cones at the edges of the AOSLO field have lower density than normal (black circles). The locations of the insets are indicated by the black rectangles on the AOSLO montage. The lower left inset over the foveal center reveals sparse, irregularly-arranged cones and hexagonal cells consistent with RPE cells. A detail of the RPE cells is shown in the upper left inset. The right inset shows the transition from absence to presence of regular cone mosaics, albeit with reduced density. The SDOCT scan (location indicated by green line on the IR fundus image) indicates disruption and loss of the IS/OS junction in the central macula along with thinning of the outer nuclear layer. (Bottom left) SDOCT 12 months after initial presentation shows further loss of the IS/OS junction and outer segment layer, indicating progressive loss of the optical components of the photoreceptors in the macula. ELM and IS/OS junction layers are labeled. (Top right) Reduced visual acuity of 20/200 corresponded to a 40-diameter central scotoma with reduced foveal sensitivity of 18 dB (normal > 34 dB). (Top right) RPE depigmentation was present in the fovea. (Center right) Fundus-guided microperimetry using a white background and a white Goldmann III 200 ms stimulus shows reduced sensitivities by 1–2 log units in the central 2 degrees. Similar results were observed in the left eye (not shown). (Bottom right) Multifocal electroretinographic first-order response densities are reduced in the central 5–10 degrees.

