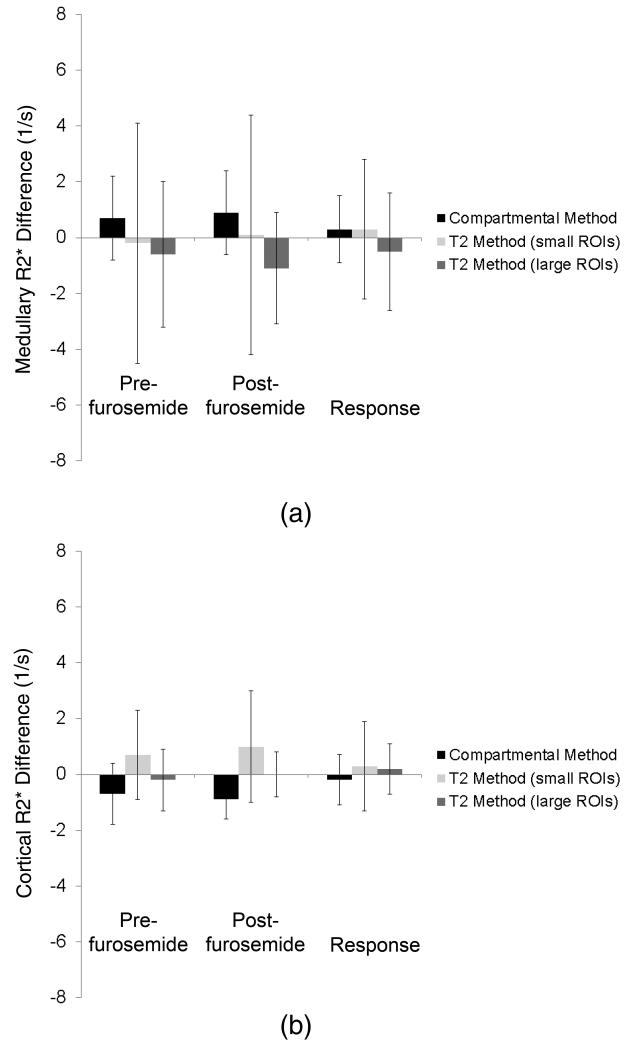
Figure 6.
R2* values in the pig medulla (top) and cortex (bottom) calculated using the compartmental and small and large-ROI T2 methods before and after furosemide, as well as the response intervention. Estimated cortical and medullary R2* values are close, but the compartmental method shows smaller variations in medullary values than the T2 method.

