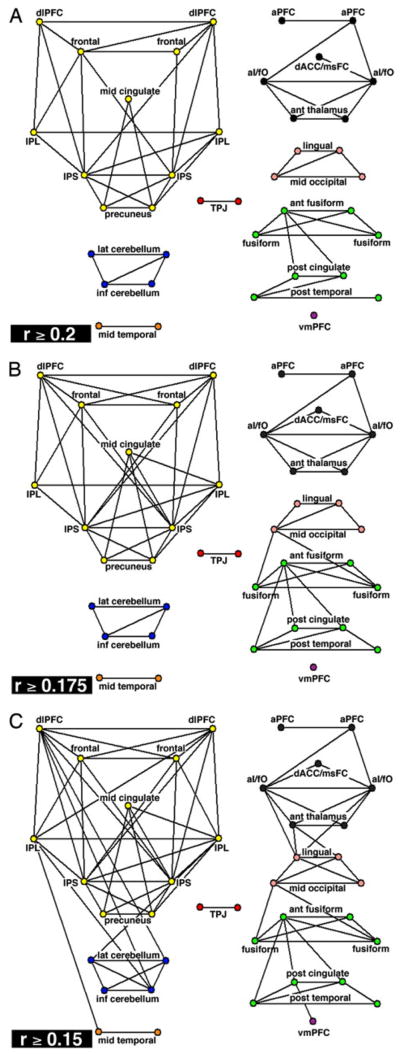
Figure 5. Task-control components in psuedoanatomical representation.
Graph analysis, using 256 frames (640s) of resting-state data, on previously defined control regions in pseudoanatomical arrangement yields two, distinct control networks that are consistent across thresholds. (A) Thresholded at r ≥ 0.2 (P<1 × 10⁻⁹; two-tailed; Bonferroni corrected; t-test). (B) Thresholded at r ≥ 0.175 (P < 1 × 10⁻⁷; two-tailed; Bonferroni corrected; t-test). (C) Thresholded at r ≥ 0.15 (P < 5 × 10⁻⁵; two-tailed; Bonferroni corrected; t-test).

