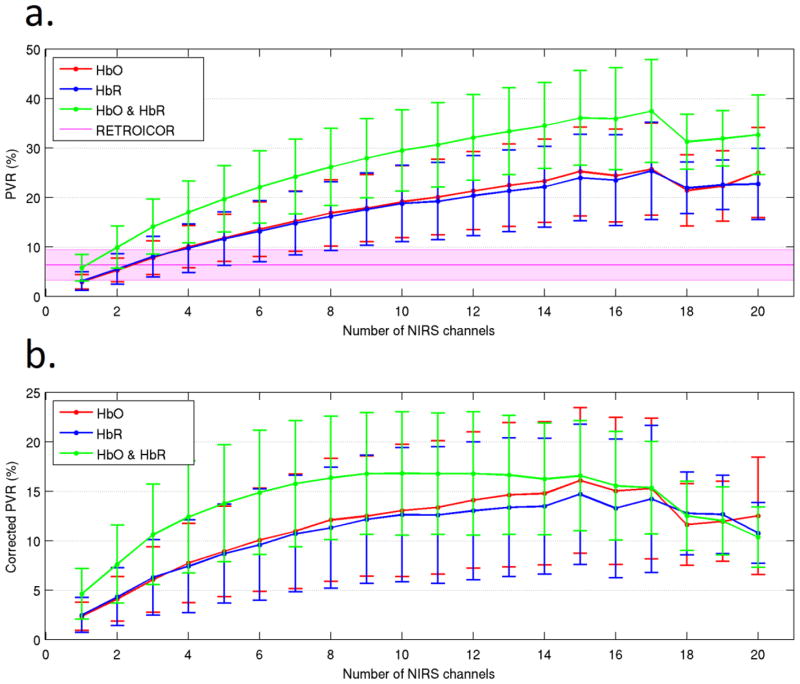
Figure 3.
The percentage variance reduction obtained by the HbO, HbR and HbO & HbR models as a function of the number of NIRS channels incorporated into each model. Values of PVR are obtained in comparison to the reference model. The corresponding results for the pulse and respiration RETROICOR model are also included. Figure 3b shows the corrected PVR values, which were obtained by subtracting the PVR achieved using synthetic NIRS regressors from that of the real NIRS regressors. These corrected results represent the extent to which the variance of the BOLD-fMRI signal can be modeled by the physiological content of the NIRS data. In each figure the error bars (and shaded region for the RETROICOR model) represent the standard deviation across all runs.

