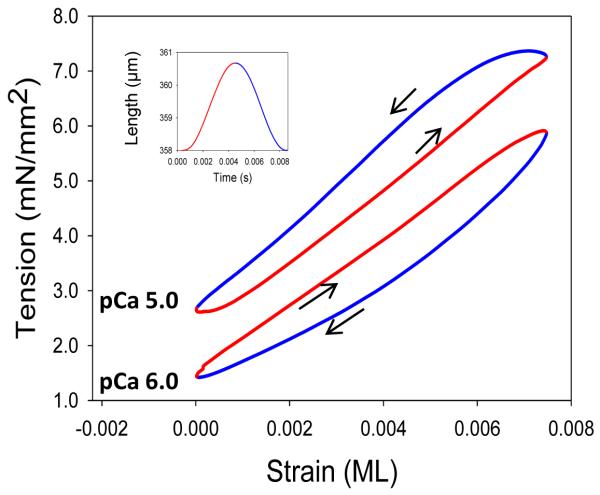
Figure 5.
Work loop analysis. Two IFM fiber work loop traces are shown, one that produces positive work, the counterclockwise loop at pCa 5.0, and one that shows only work absorption, clockwise at pCa 6.0. Arrows indicate clockwise and counterclockwise loops. The inset shows one muscle length change cycle and the color coding of red for muscle lengthening and blue for muscle shortening. The IFM fiber was oscillated at 125 Hz at 0.75% ML.

