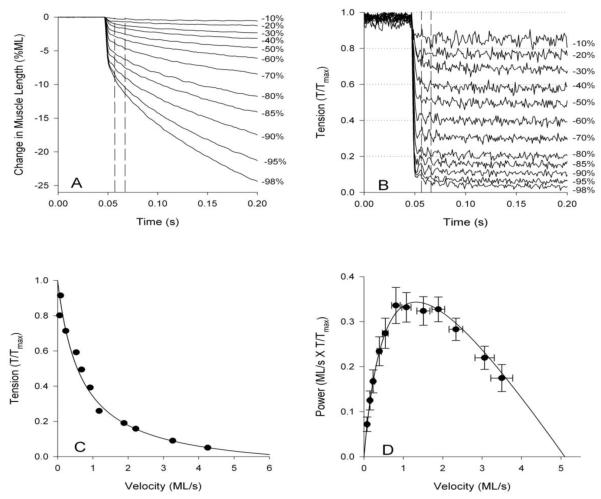
Figure 8.
Tension-velocity curves and steady-state power curves using the jump muscle. A) The muscle is shortened at a speed that will maintain B) a constant set tension level. Numbers to the right indicated the percent decrease in tension from maximum isometric tension. Vertical dotted lines indicate the time period over which shortening velocity was calculated. C) Tension and velocity are plotted to reveal the characteristic hyperbolic shape of the tension-velocity curve. D) Power is calculated by multiplying tension and velocity and, in this case, plotted against velocity rather than tension. Modified from Eldred et al. [2].

