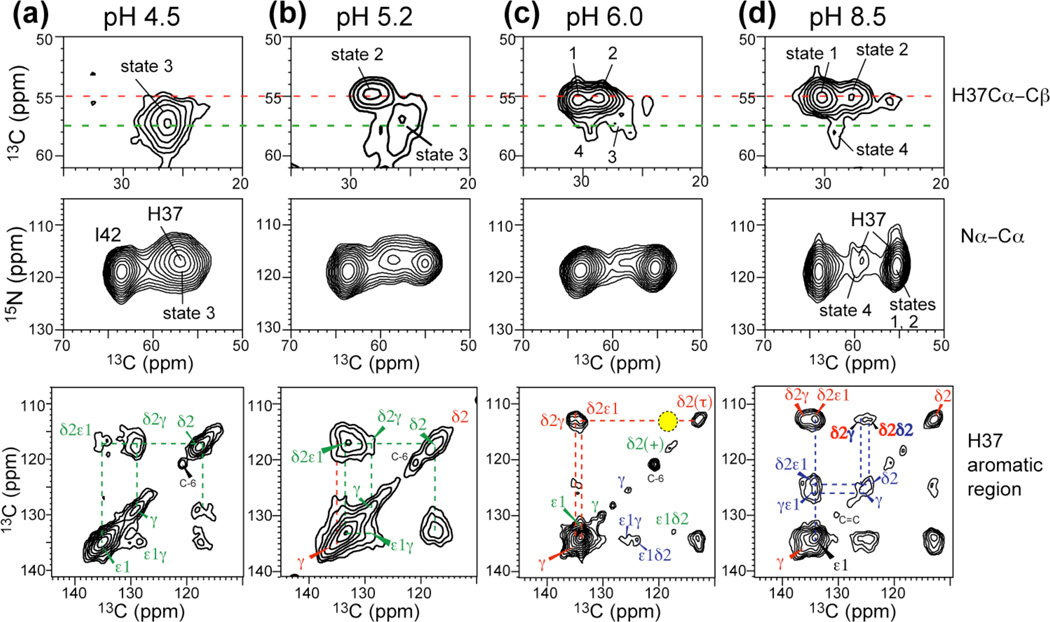
Fig. 3.
2D 13C-13C and 15N-13C correlation spectra of His37 at 273 K or 243 K as a function of pH. (a) pH 4.5. (b) pH 5.2. (c) pH 6. (d) pH 8.5. States 1–4 denote different backbone conformations41. 13C-13C 2D correlation spectra were measured with mixing times of 40 ms or 60 ms. No neutral-cationic Cδ2(τ)-Cδ2(+) cross peak was observed (yellow shade) at pH 6.0. A 300 ms spectrum (Fig. S3a) confirms the lack of imidazole-imidazolium contact.

