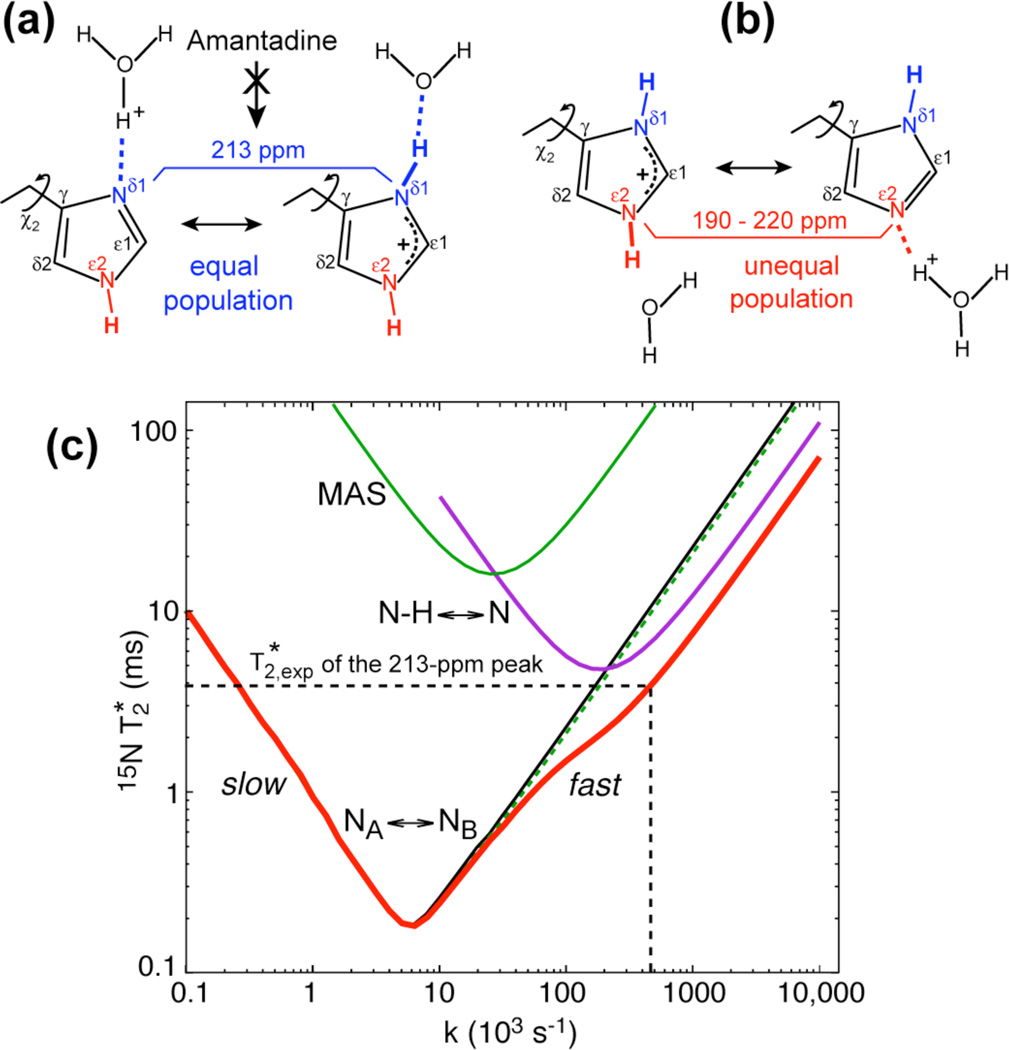
Fig. 4.
Proton exchange models of His37 and simulations of 15N T2 to determine the exchange rates. (a) Equal-population Nδ1-Nδ1H exchange, which is suppressed by the drug. (b) Unequal-population Nε2H-Nε2 exchange. (c) Dependence of 15N exchange-induced on the exchange rate k. Black line: exchange of isotropic chemical shifts only (NA ↔ NB). Green curve at top center: exchange of anisotropic chemical shifts (ΔδCSA/2π = 2 kHz) under 7 kHz MAS. Green dashed line: exchange of isotropic (Δν = 3 kHz) and anisotropic chemical shifts under MAS. Purple curve at top right: N-H dipolar modulation (ΔδNH/2π= 9 kHz) under 63 kHz 1H decoupling (N-H ↔ N). Thick red line: full simulation combining all three effects.

