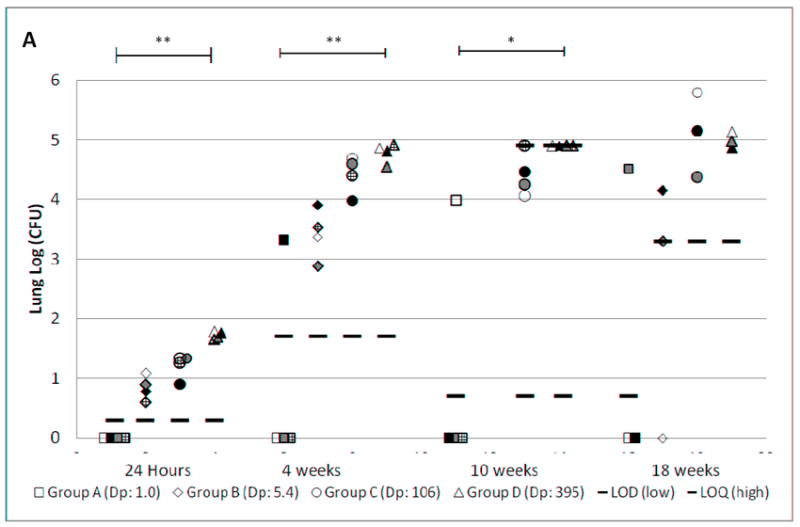
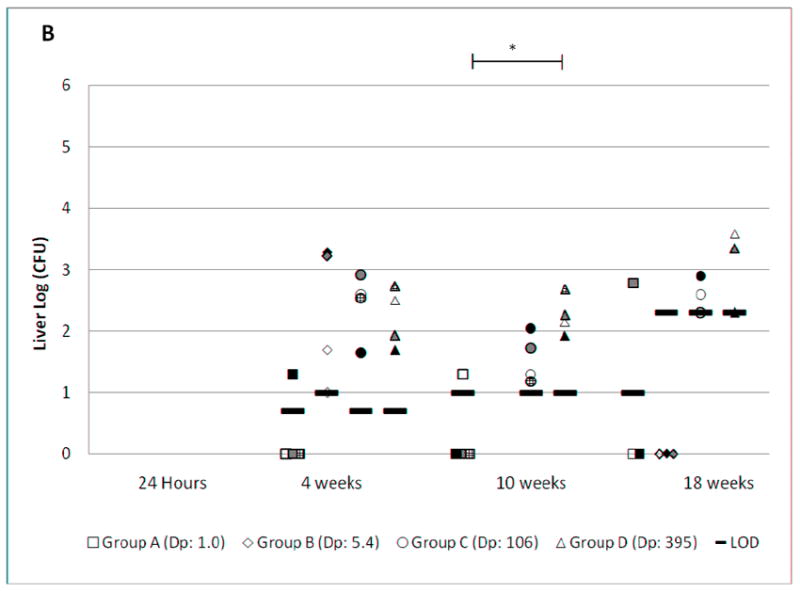
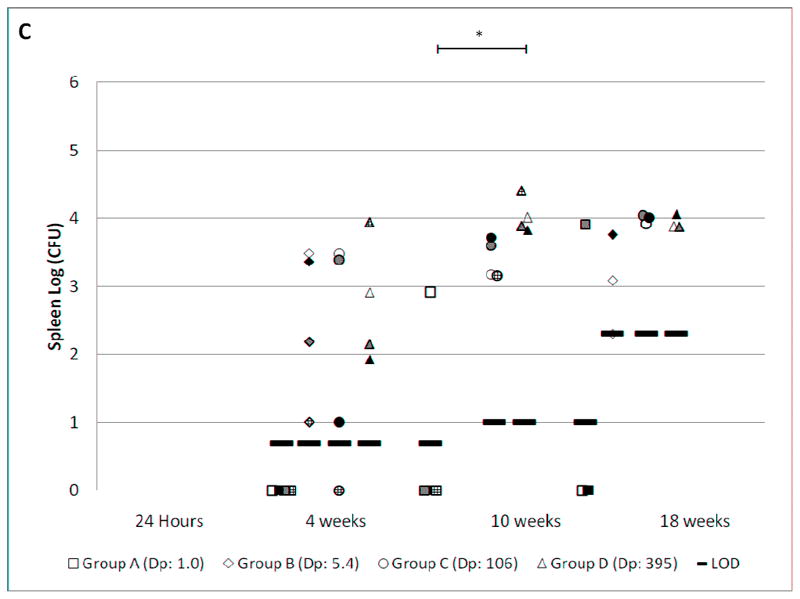
Figure 1. MTB CFU at varied time points after infection.


Female C57BL/6 mice were exposed to various concentrations of MTB aerosol (Table 1), resulting in the presented doses (Dp) indicated in the legend. CFU from lung (Fig. 1A), liver (Fig. 1B) and spleen (Fig. 1C) were determined by necropsy at the time points shown. The limit of detection (LOD) is shown for each group at each time point. The upper limit of quantitation (LOQ) is also shown when applicable. Groups A, B, C, and D are represented by square, diamond, circle, and triangle shapes, respectively. Individual mice within each exposure group have the same pattern in the lung, liver, and spleen charts. When no bacteria were grown, the results are plotted on the X-axis. Mean log CFU±SD for infected mice in each exposure group are shown in the box. The brackets show statistically significant linear correlations between the log-transformed Dp and log-transformed organ CFU across the four exposure groups (**, p<0.001. *, p<0.05).
