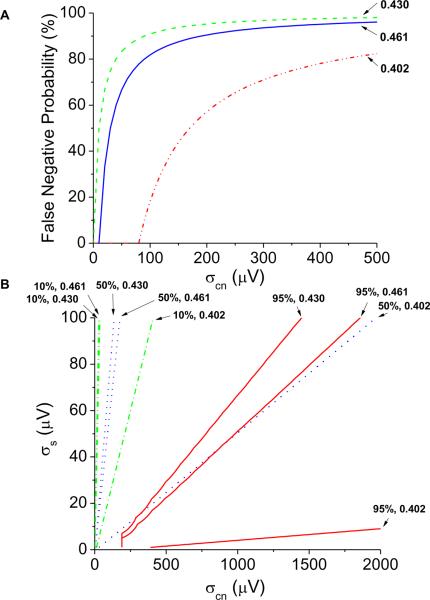
Figure 6.
Effect of colored noise (at 0.402, 0.430, and 0.461 cycles/beat) on the noise band and the probability for a false negative result. (A) The false negative probability (alternans voltage ≤ 1.8 μV) in the presence of alternans quantified as a function of the colored noise amplitude. (B) False negative Kscore (Kscore < 3) in the presence of alternans quantified as a function of the colored noise amplitude. False negative Kscore percentages of 10%, 50%, and 95% are plotted. For each colored noise and signal combination, the false negative Kscore percent is equal to the percentage of false negative Kscores at all points less than or equal to the colored noise and signal amplitudes.

