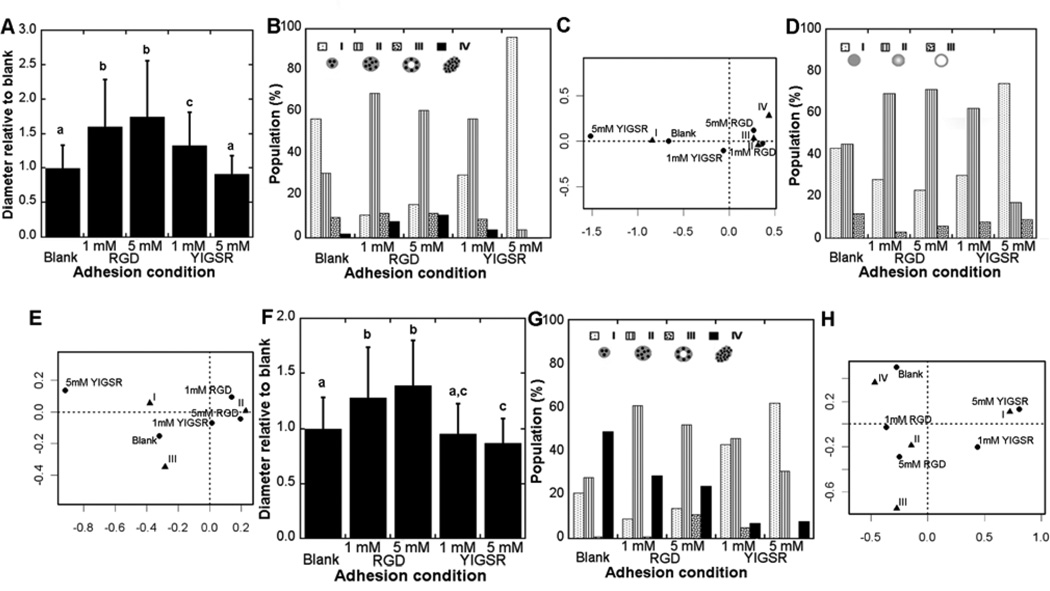
Figure 5. Influence of adhesion on cancerous MEC phenotypes.
10A.ErbB2 and 231 cells in PEG hydrogels both produced a variety of phenotypes that depended on adhesion identity and concentration. Sizes of 10A.ErbB2 structures were measured and normalized to blank hydrogels for a given experiment (A), with mean +/− s.d. values taken from three independent experiments. Conditions with different letters were significantly different (p<0.05). Confocal images for structures were classified as described in Fig. 3 for cell organizations and laminin V distributions. 10A.ErbB2 cell organization showed differences between adhesion conditions (p=2e-15) (B) with associations revealed by correspondence analysis (C). Laminin V distribution within 10A.ErbB2 structures varied with adhesion condition (p=8e-5) (D) with associations revealed by correspondence analysis (E). Sizes of 231 structures were measured and normalized to blank hydrogels for a given experiment (F). 231 cell organization had differences between adhesion conditions (p<2e-16) (G) with associations revealed by correspondence analysis (H).

