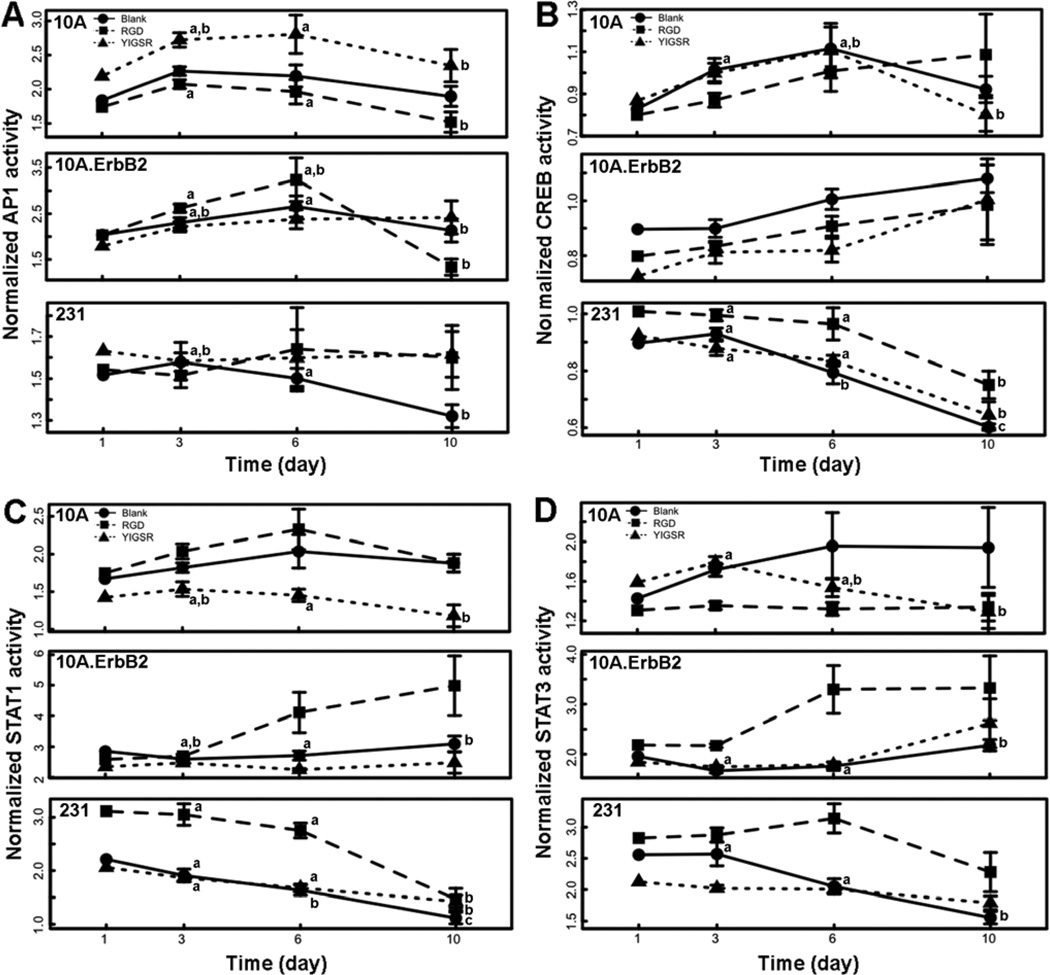
Figure 6. Dynamic activity of signaling pathways.
Signaling pathways within living cells were quantified within PEG hydrogels either left blank (circles) or containing RGD (squares) or YIGSR (triangles) peptides by assessing activity of AP1 (A), CREB (B), STAT1 (C), or STAT3 (D) over time. The means ± s.e. from triplicate hydrogels from three independent experiments are plotted. Significant differences over time within each peptide condition are represented by letters (a, b, c) (p<0.05).

