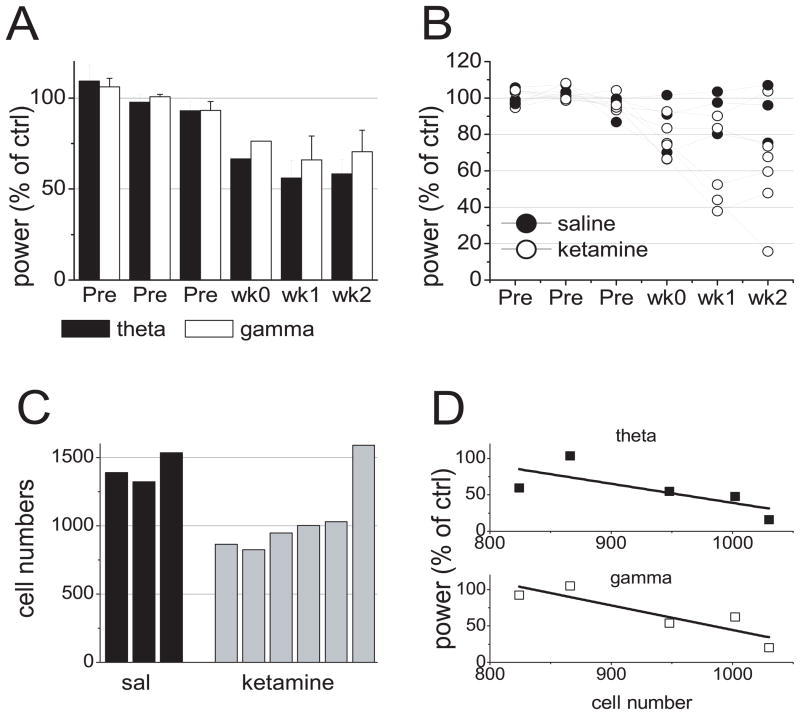
Figure 7.
Comparison of loss of PV+ cells in the hippocampus and decrease in theta and gamma power. A. Group averages of hippocampal CA1 theta and gamma power before (Pre) and after chronic ketamine treatment in 6 rats. B. Changes in hippocampal CA1 theta power in individual experiments treated with saline (n=3) or ketamine (n=6). C. Number of detectable PV+ cells in the CA1 area of the hippocampus of the same group of rats. D. Scatter plot of theta (top) and gamma power (bottom) 2 weeks after ketamine treatment, expressed as percent of pre-injection average, vs. PV+ cell number, in 5 rats which showed loss of PV+ cells.

