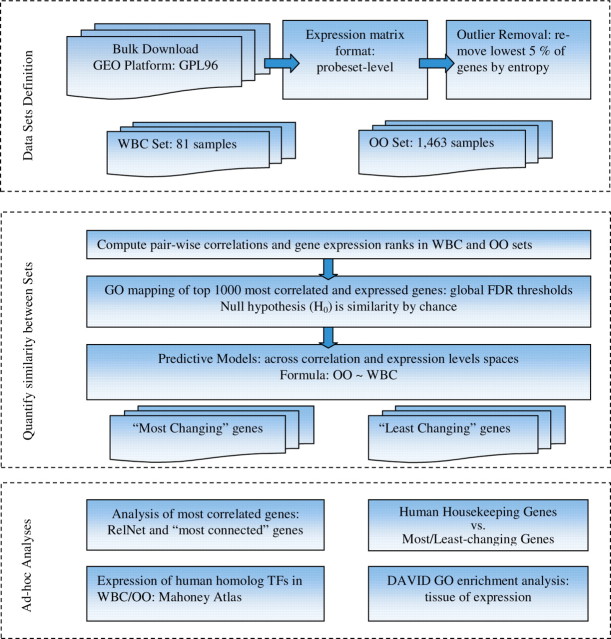
Fig. 1.
A diagram representing the workflow of the analysis. (i) ‘Data Sets Definition’ includes bulk download of the GEO archive files for the GPL96 platform, parsing out all GSM sample files with similar probeset-averaged expression matrix, detecting and removing outlier genes and constructing two sets for comparison, WBC and OO sets. (ii) ‘Quantify Similarity between sets’ include: use GO mapping of the most correlated (highly expressed) genes (as defined by their FDR q-value thresholds) to quantify change across sets; the null hypothesis H0 is overlap between corresponding sets from WBC and OO by chance); use a linear model and general least squares and PCA to quantify relationships between OO and WBC across expression and correlation profiles, respectively; define two list of ‘most-changing’ and ‘least-changing’ from WBC to OO genes, across expression profiles. (iii) In ‘Ad-hoc Analyses’, we first construct the RelNets of the 200 most correlated WBC genes and their corresponding OO pairs ranks changes. We next looked at the TFs human homologs from the Mahoney Atlas as expressed in WBC. Another step is looking at how the most-changing and least-changing genes from step (ii) are represented in the list of human housekeeping genes. Finally, we run GO enrichment analysis of the ‘least-changing’ genes with respect to ‘tissue-of-expression’, in DAVID.

