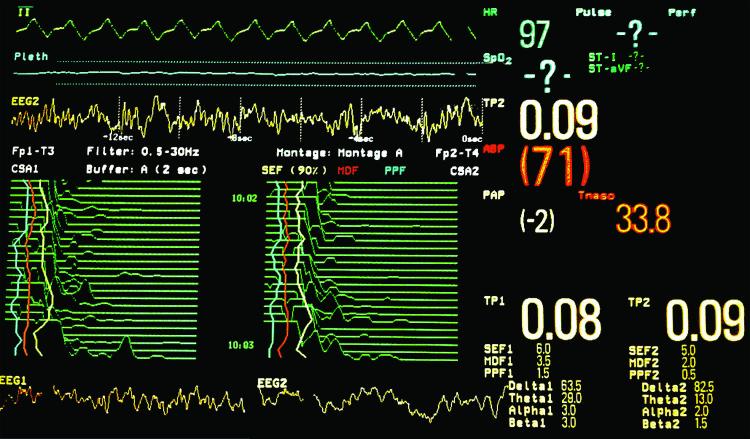
Figure 2.
Photograph of the screen of a Philips IntelliVue MP90 patient monitor®. The MP90 allows several monitors to be used concurrently with different configurations. With the Philips Electroencephalography (EEG) measurement module, the monitor can be configured to display real-time raw waveforms from two EEG channels, compressed spectral array (CSA) for each channel of EEG, total power (TP) percent in each frequency band (delta, theta, alpha, beta), spectral edge frequency (SEF), mean dominant frequency (MDF), and peak power frequency (PPF). This screen shot was taken during cardiopulmonary bypass shortly after aortic clamp removal. The third waveform on the screen is a 16-second epoch from a right-sided frontal EEG channel (EEG2); the sweep speed is 12.5 mm/sec. A slow underlying delta waveform (<1 Hz.) pattern is evident. The two bottom waveforms are each 4-second epochs from a left (EEG1) and right (EEG2) sided frontal EEG channel; the sweep speed is 25 mm/sec. A slow delta pattern (<1 Hz.) is evident as well as predominantly theta (4-8 Hz.) and delta waves (0-4 Hz.). The compressed spectral arrays graphically depict the peaks in different EEG frequencies from 0 to 30 Hz. over time; the display is refreshed every two seconds. Peaks in the lower frequencies are on the left and higher frequencies are on the right. From each of the arrays, 30-second trends can be appreciated. The percent power in each frequency band shows that >90% of the power is in the theta and delta frequencies. This is consistent with both of the spectral edge frequencies (SEF 90%), which are 6 Hz. for EEG1 and 5 Hz. for EEG2. The spectral edge frequency trend for each channel is depicted by the yellow lines on the compressed spectral arrays.

