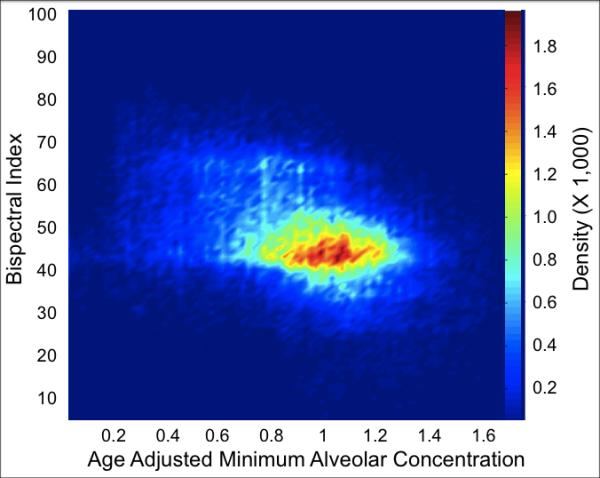
Figure 3.

A density contour plot from 700 sequential patients who underwent cardiac surgery and were enrolled in the BAG-RECALL clinical trial.18 Data points are from the maintenance period of anesthesia. This representation, similar to a plot depicted by Whitlock et al.,52 demonstrates that over a clinically relevant range of age-adjusted minimum alveolar concentrations (i.e., 0.5 to 1.5 MAC), the Bispectral Index (the dependent variable) displays its highest densities (mode) in the low forties.
