Figure 4.
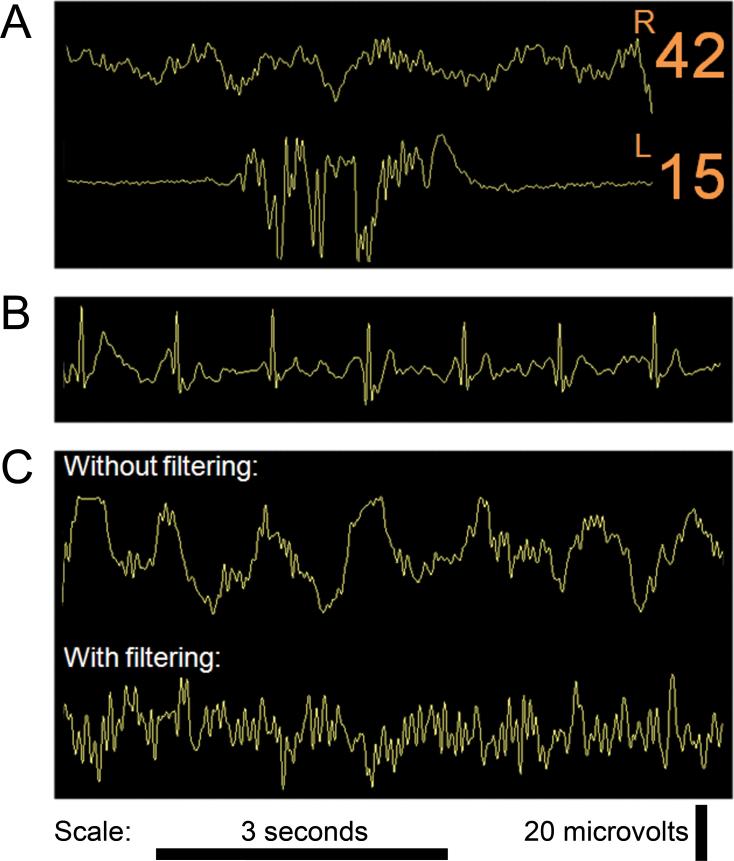
Notable features on intraoperative electroencephalogram (EEG) or Bispectral Index (BIS) monitoring. A, this shows two EEG traces and corresponding BIS values. These traces reflect a hypothetical situation where bilateral frontal EEG recordings are taken. The right channel shows an underlying slow delta wave pattern with higher frequency waves (e.g., faster delta, theta and alpha waves) also apparent. The left channel shows a burst suppression pattern. Such asymmetry could occur with unilateral (left) frontal hypoperfusion. B, This is an EEG trace obtained from a BIS monitor®. Cardiopulmonary bypass had been initiated and the patient's EEG was persistently suppressed. The raw trace shows marked electrocardiographic (ECG) artifact in the persistently suppressed raw EEG trace. Automated analysis may not recognize the ECG waveform as readily as a trained anesthesiologist. C, the effect of filtering on the EEG. The first trace shows a typical EEG epoch during general anesthesia, with an underlying slow delta pattern. There are also higher frequency waves (e.g., faster delta, theta and alpha waves) apparent. In the second trace, the higher frequency waves are still apparent, but the underlying slow delta pattern has been attenuated by the BIS monitor's® filters. The BIS automatically outputs a filtered EEG trace; filters may obscure useful information. In this case, large delta waves consistent with deep anesthesia were filtered out, potentially preventing the anesthesiologist from appreciating the true anesthetic depth. EEG tracings were obtained using a BIS Quatro Sensor (version XP; Covidien, Boulder, CO).

