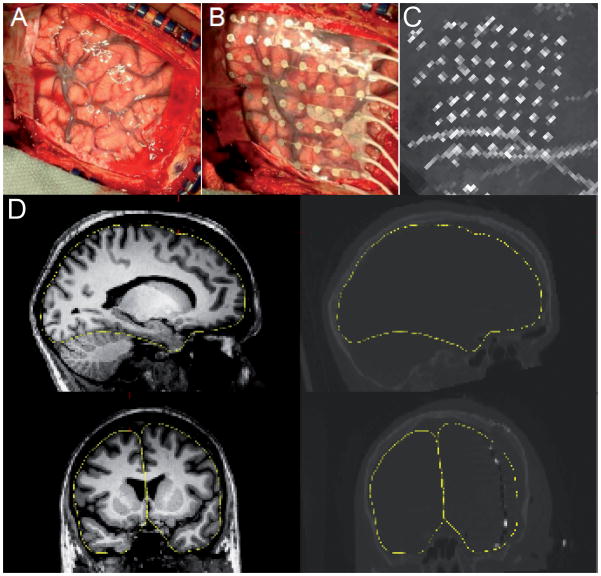
Figure 1. Intraoperative photographs, MRI-CT coregistration, and maximal-intensity projection.
(A) Reflected dura, exposed pial surface and overlaid electrode array (B) from a typical craniotomy. (C) The sagittal maximal-intensity projection of the postoperative CT scan, showing most of the electrode sites in a single view. (D) Illustration of the accuracy of the coregistration between the preoperative MRI and the postoperative CT. The left panels show sagittal (top) and coronal (bottom) views of a single subject’s (patient 5) MRI; the right panels show the same orientations for the postoperative CT. Electrode sites can be seen as bright spots in the coronal CT section. The yellow trace outlines the pial surface in both the MRI and CT.

