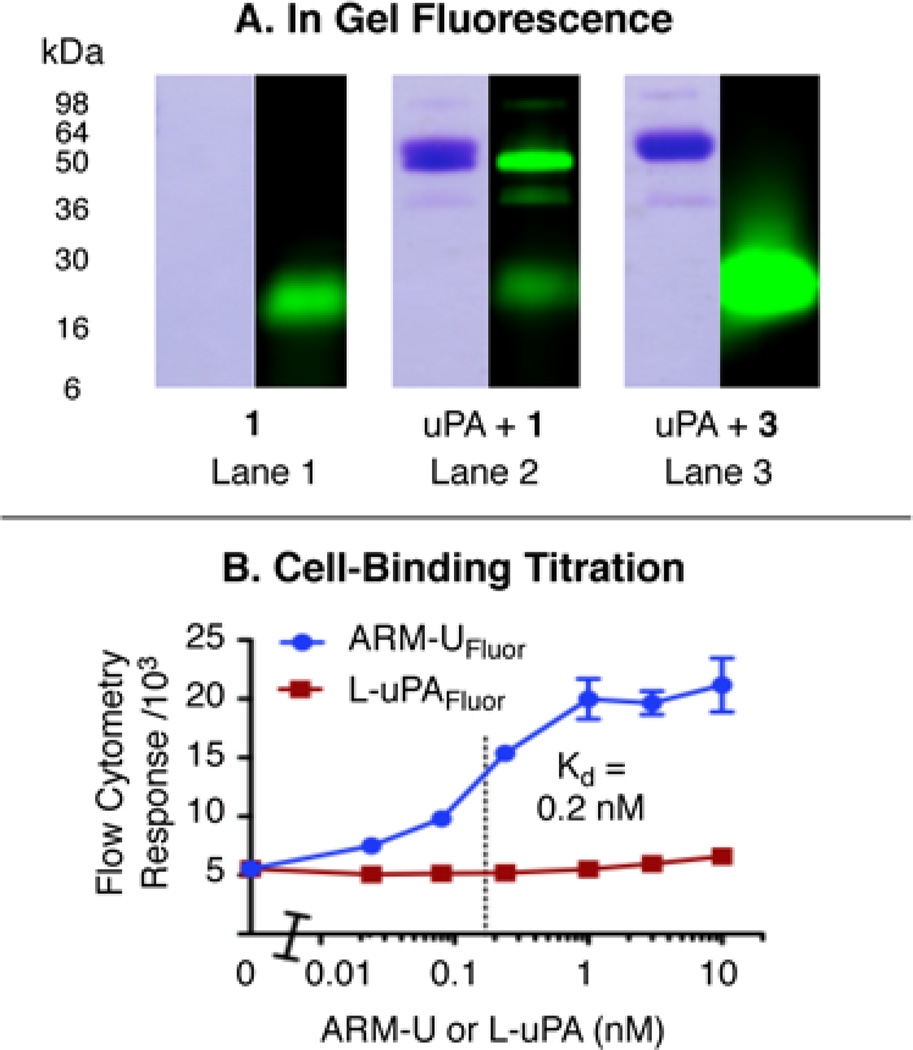
Figure 3.
(A) In-gel fluorescence (488 nm excitation, 532 nm emission, right) and Coomassie stain (left) analyses of mixtures of compound 1 (15 µM), uPA (10 µM), and compound 3 (60 µM). (B) Flow cytometry measurements of ARM-UFluor binding to HT-29 cells compared to L-uPAFluor as a negative control. Data points represent average values from triplicate experiments ± standard deviation.

